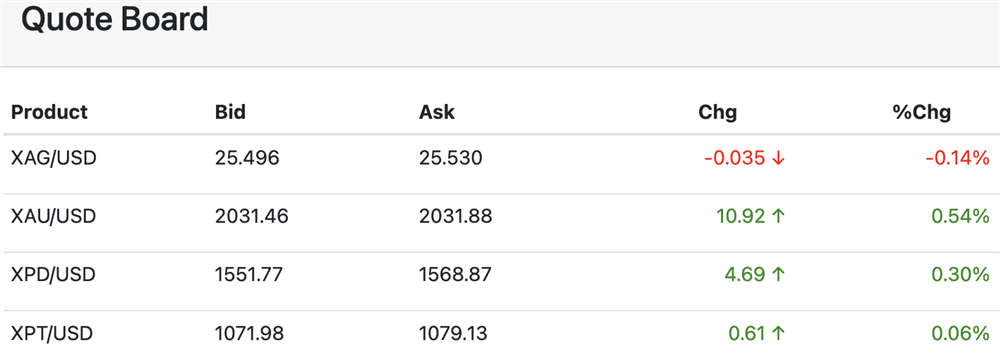
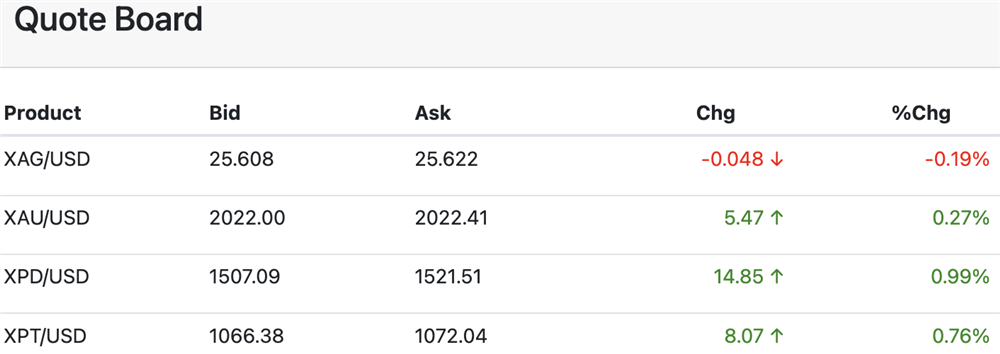
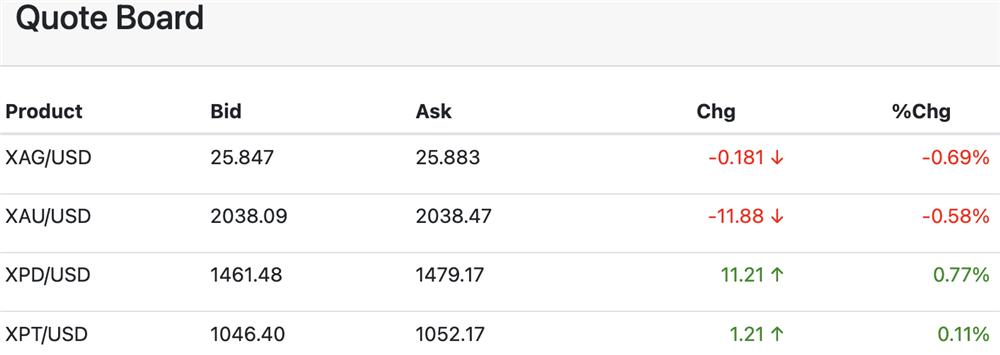
Gold continues to trade above the $2000 level, buoyed by a host of fundamental factors as well as bullish technicals. The yellow metal posted a 1.4% gain last week, despite the sharp sell-off on Friday that was triggered by another better-than-expected jobs report.
Spot Gold Daily Chart through 5/8/2023
Gold ended April with a gain of just over 1%. It was the second consecutive higher monthly close.
The Fed raised interest rates by another 25 -bps last Wednesday. However, key language was dropped from the policy statement, which suggested the much-anticipated pause in the tightening cycle may be upon us.
Gold liked the notion that rates may have peaked and pressured the April high at $2048.77. On Thursday, key resistance at $2070.64/$2075.28 was approached on reports of a drone attack on the Kremlin.
The yellow metal also continues to garner support from persistent concerns about the banking system. Last week, First Republic Bank became the third U.S. bank to fail this year.
It was the second-largest bank failure in U.S. history behind Washington Mutual which collapsed in 2008. First Republic assets were snapped up by JPMorgan Chase, but First Republic shareholders are likely wiped out according to CBS News.
This is going to perpetuate pressure on regional bank shares, as well as the run on deposits. Another bank, PacWest Bancorp, has acknowledged they are “exploring strategic options,” which means they are looking for a buyer before they are seized as well.
While the Fed and Treasury continue to assure us that the banking system is “sound,” minutes from the March FOMC meeting revealed that staff believes the crisis will lead to recession. This seems to suggest that banking sector turmoil will continue for some time, perhaps until rates start coming down and businesses start borrowing again rather than burning through savings.
Of course, a reversal of the Fed’s tightening cycle is going to be largely dependent on lower inflation. April CPI will be released on Wednesday and the market is expecting +0.4% m/m. PPI comes out on Thursday with median expectations of +0.3% m/m.
Treasury Secretary Janet Yellen has warned that failing to raise the debt ceiling could lead to “financial chaos” and an “economic catastrophe.” The current “extraordinary measures” being deployed to keep the country afloat could be exhausted as soon as June 1.
While the political brinksmanship will continue, possibly to the 11th hour, be assured the debt ceiling will be raised. It always is.
However, the politicians are messing with the “full faith and credit” of the United States in the midst of a burgeoning banking crisis that was triggered in large part by higher interest rates. As the risk of a U.S. default escalates, it puts upward pressure on rates.
Also keep in mind, that we are in the midst of a global de-dollarization movement. Other countries are already eager to become less reliant on the greenback. A rise in U.S. credit risk is only going to accelerate that desire. A weaker dollar bodes well for gold.
The World Gold Council reported that central bank gold demand reached a Q1 record of 228 tonnes this year. That’s 34% higher than the previous Q1 record of 171 tonnes set in 2013. The WGC said the central banks “remained keen and committed buyers of gold.”
As the central banks of the world continue to aggressively diversify their reserve holdings by buying gold, individual investors should strongly consider doing the same.
Silver
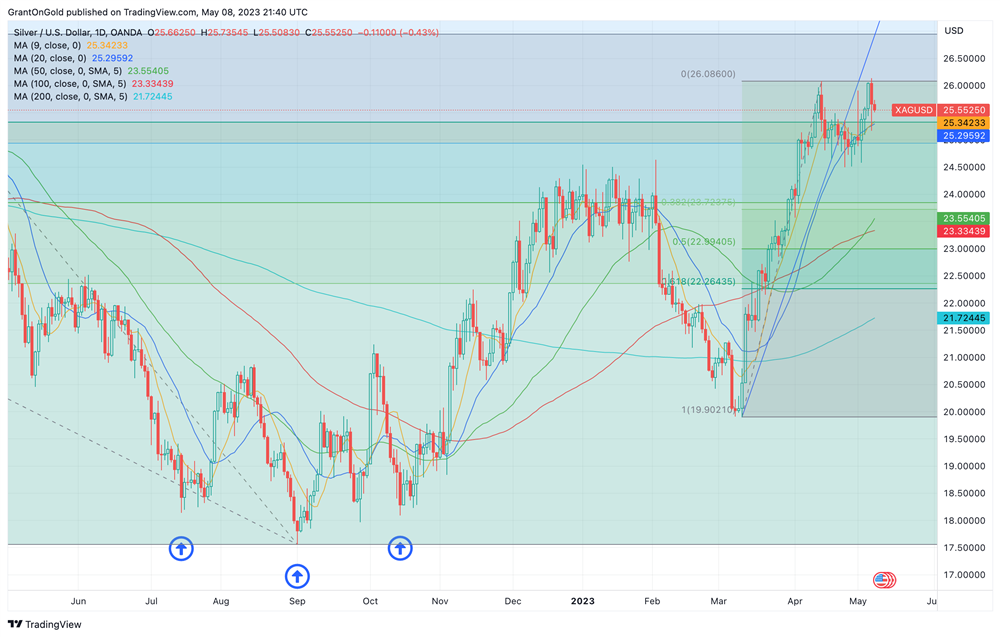
Silver set a more than one-year high last week at $26.14 before retreating into the range. The white metal notched a 2.4% weekly gain, and the overall technical bias remains to the upside.

Spot Silver Daily Chart through 5/8/2023
Silver continues to show great resiliency even as recession risks mount. Silver also is well supported versus gold, which is typically a bullish signal for both of the precious metals.
The market continues to anticipate strong demand for silver driven by the ongoing electrification of the global economy. Global demand for silver rose 18% in 2022 to a record 1.24 billion ounces.
According to Philip Newman of Metals Focus, “We are moving into a different paradigm for the market, one of ongoing deficits.” The silver market had a deficit of 51.1 Moz in 2021, which grew to 237.7 Moz in 2022. The deficit for 2023 is forecast to be 142.1 Moz.
The IMF is predicting that Asia and the Pacific – led by India and China – will be the most dynamic region in terms of growth in 2023. The region is expected to account for 70% of global growth in 2023! That bodes well for a whole host of industrial metals, including silver.
India and China are also the two largest buyers of gold.
Even if the U.S. slips into recession, any regional demand destruction could be offset by accelerating growth in Asia.
Strong and growing demand along with supply deficits should keep the price underpinned with potential to $30 and beyond. Retreats into the range are likely to be viewed as buying opportunities.
PGMs
While platinum closed lower last week, it continues to hold an important trendline on a close basis. Recent corrective action is holding comfortably above $1000.
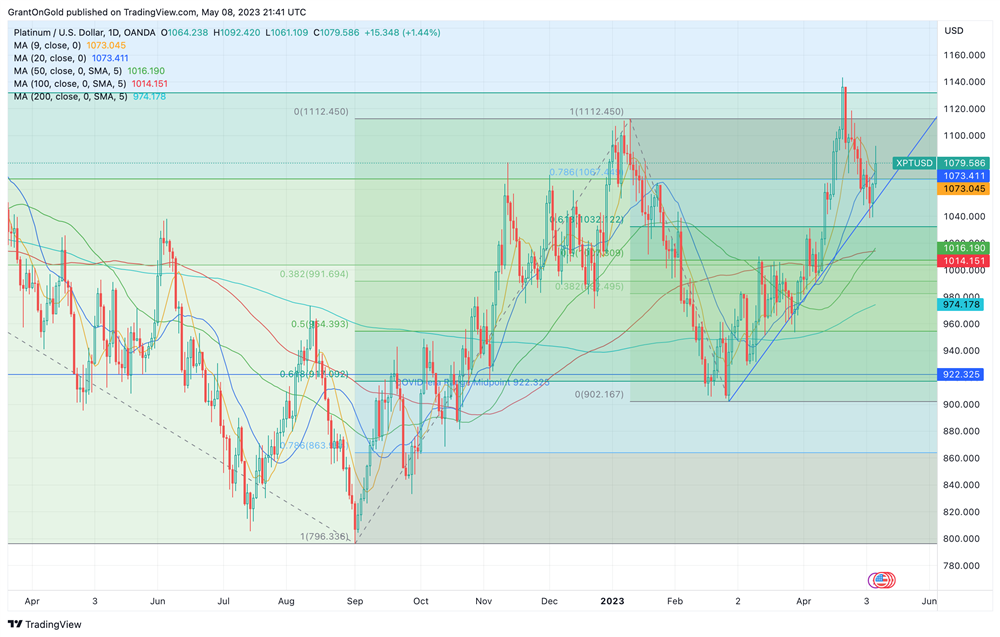
Spot Platinum Daily Chart through 5/8/2023
Heraeus believes that platinum investors are finally taking note of South Africa’s power problems. Load shedding could result in a loss of 250 koz of platinum production.
Demand prospects, particularly from the auto industry, continue to improve even as the market share of EVs grows. Platinum for palladium substitution remains a significant theme as well.
Palladium has seen a nice pop in recent sessions but remains within striking distance of the nearly 4-year low set in March at $1329.18.
Non-Reliance and Risk Disclosure: The opinions expressed here are for general information purposes only and should not be construed as trade recommendations, nor a solicitation of an offer to buy or sell any precious metals product. The material presented is based on information that we consider reliable, but we do not represent that it is accurate, complete, and/or up-to-date, and it should not be relied on as such. Opinions expressed are current as of the time of posting and only represent the views of the author and not those of Zaner Metals LLC unless otherwise expressly noted.
