Good morning. The precious metals are higher in early US trading.
Middle East headlines dominate. Firing suggests the ceasefire is breaking down. Stronger dollar and oil prices dim rate cut hopes and limit upside for metals. Focus on US jobs data this week.
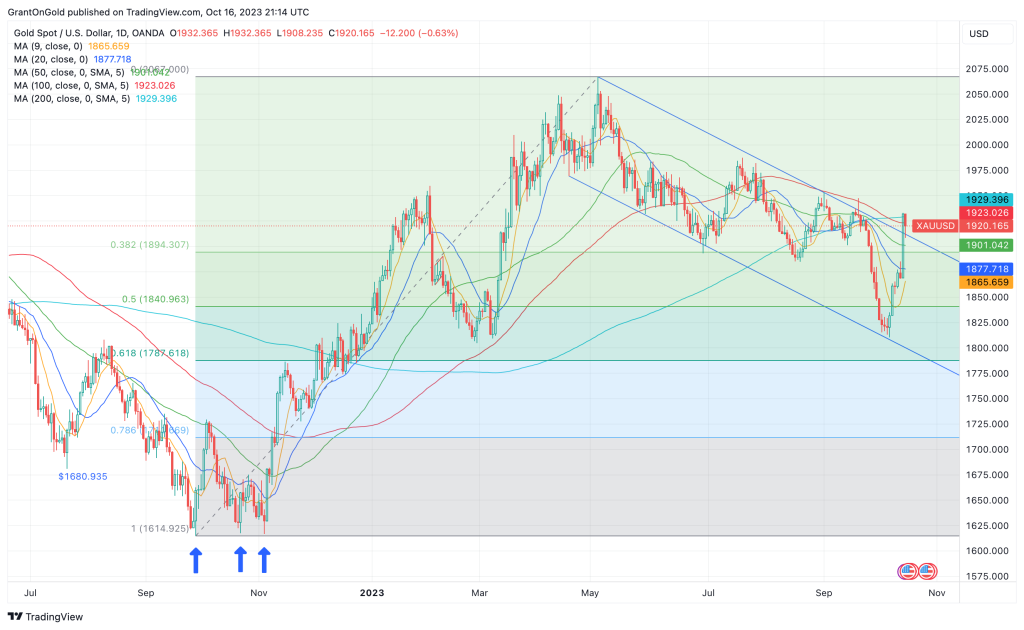
Gold surged nearly 5.5% last week, spurred by safe-haven buying in the wake of the horrific October 7th attack on Israel. While downside retracement was seen on Monday, the initial push back above the $1900 level leaves the low end of the bear channel well protected for the time being.
Spot Gold Daily Chart through 10/16/2023
With an Israeli ground offensive into Gaza thought to be imminent, and amid worries that the conflict could expand, look for the yellow metal to remain underpinned. Iran has warned Israel of “far reaching consequences” should they launch a ground invasion.
Gold is garnering additional lift from rising hopes that the Fed is done raising rates this year. The CME’s FedWatch tool puts the probability of a November rate hike at just 5.2%, while the odds for a December rate hike stand at 32.7%.
While PPI rebounded in September to 2.2% y/y, and CPI held steady at 3.7%, members of the Fed still seem to be encouraged by the progress in the fight against inflation.
“Absent a stark turn in what I see in the data and hear from contacts … I believe that we are at the point where we can hold rates where they are,” said Philadelphia Fed President Patrick Harker. Raphael Bostic of the Atlanta Fed stated last week that he does not believe that the FOMC needs to hike again.
There is still a wide belief that the Fed’s next move is very data-dependent. The present stance has been categorized as a “hawkish hold.” As long as the trajectory for inflation is down, the central bank will likely keep rates as they are.
Monday’s low at $1908.23 now provides a good intervening support level ahead of the 38.2% retracement level of the rally off the $1810.46 low, which comes in at $1886.14.
On the upside, the next tier of resistance is found at $1947.46/$1953.06. A breach of this area would exceed the halfway back point of the entire decline off the $2067.00 high from May, shifting focus to the 61.8% retracement level at $1969.00.
As long as geopolitical tensions remain elevated and nearby supports are intact, setbacks into the range are likely to be viewed as buying opportunities.
While haven flows have gold and the dollar moving generally in tandem at the moment, keep an eye on that relationship for short-term directional cues.
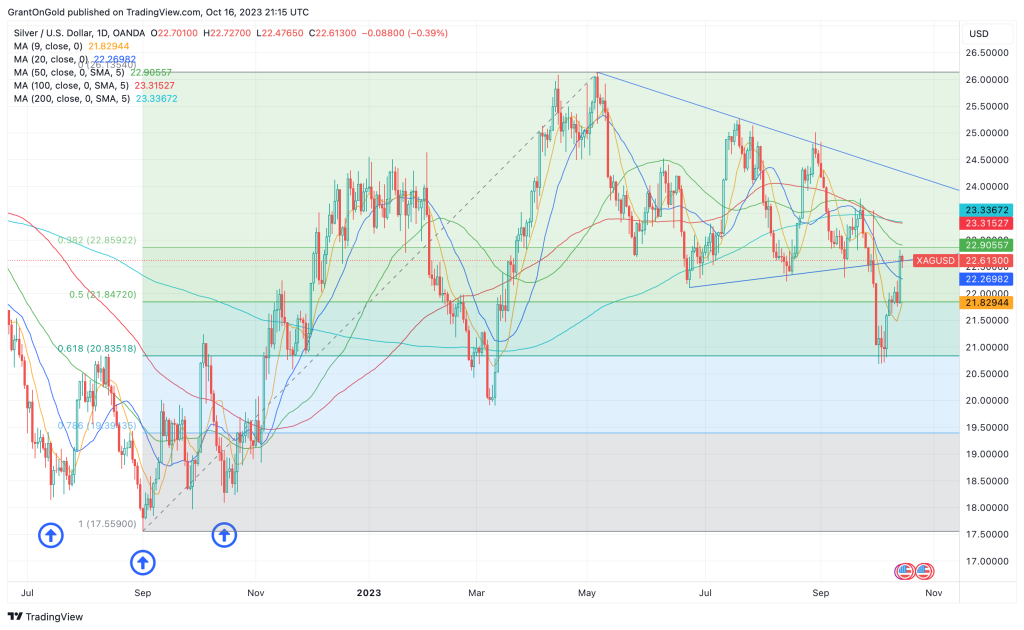
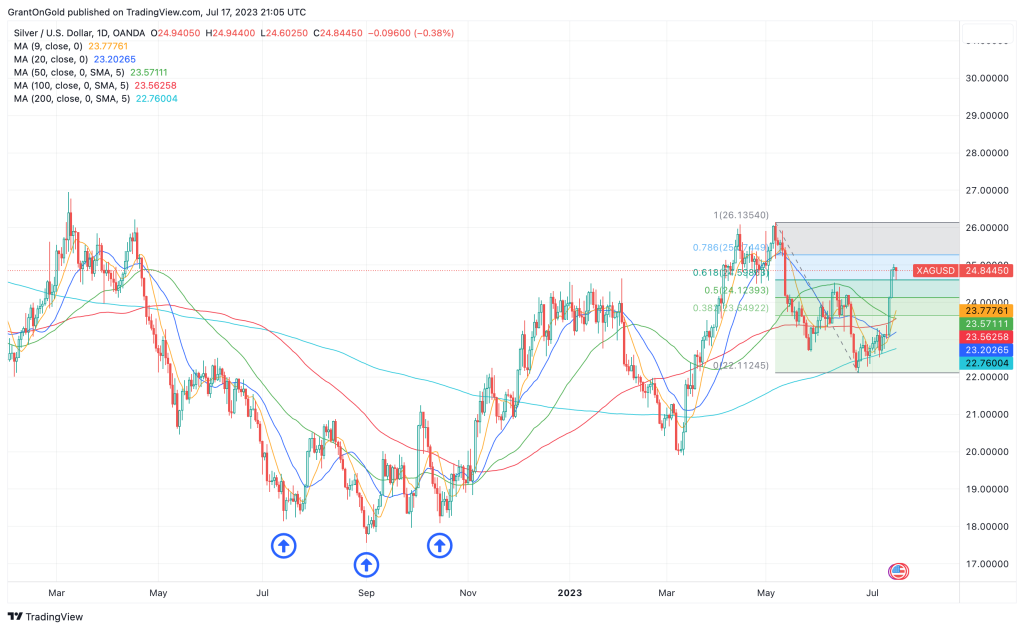
Silver
Silver rose just over 5% last week as outside forces stoked market volatility. Despite the strong rally, additional gains are needed to set a more favorable technical tone.
Spot Silver Daily Chart through 10/16/2023
A rebound above $23.41 would constitute a 50% retracement of the decline from the May high at $26.14. It would also put silver back above its 100- and 200-day moving averages. This would have rather bullish implications.
A retreat below $21.80/75 would return focus to the bearish scenario that has dominated since the downside breakout of the large triangle pattern. Such a move would return focus to the $20.68 low from October 3 and highlight the low for the year at $19.90 once again.
While silver followed gold higher last week, the white metal is probably more concerned about the implications of another war on regional and global growth, as well as prices. If signs of stagflation begin to surface, silver would likely remain defensive.
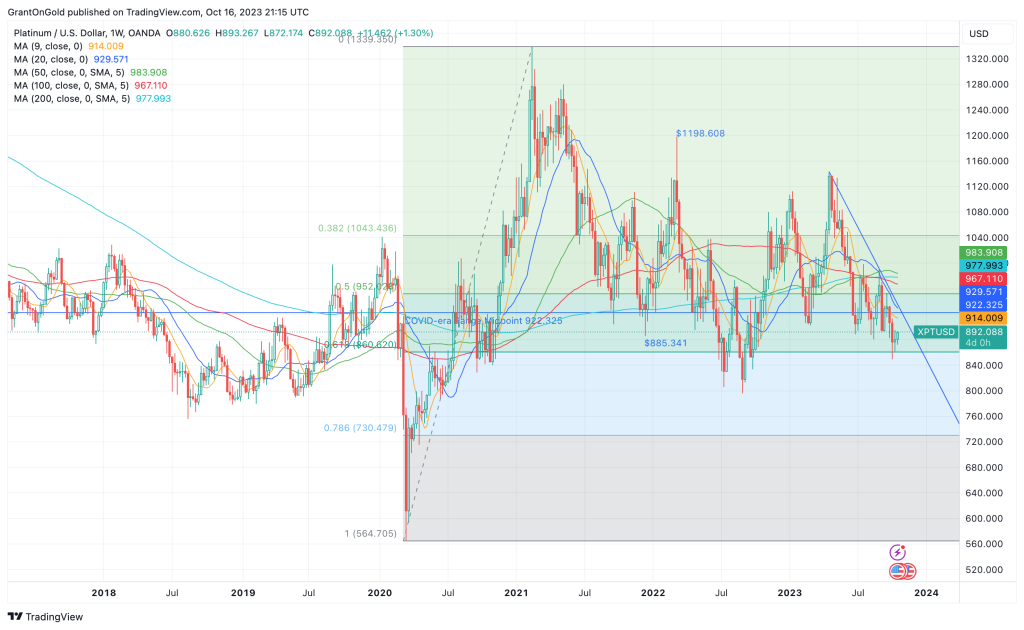
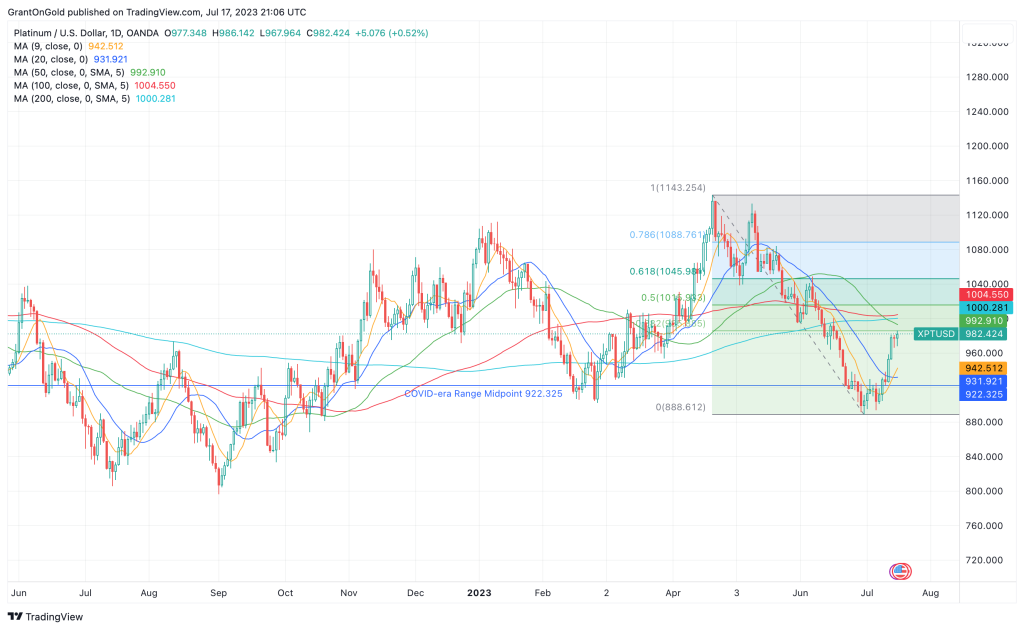
PGMs
Platinum was comparatively subdued last week, rising a scant 0.5% with activity confined to the previous week’s range. Consolidative trading prevailed on Monday.
Spot Platinum Daily Chart through 10/16/2023
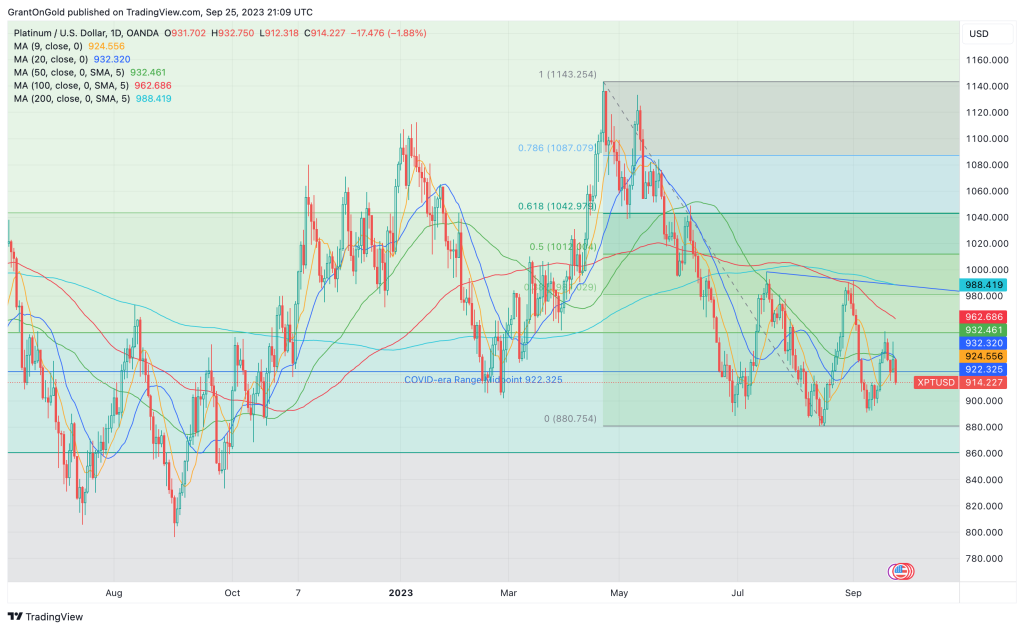
The short-term technical bias remains negative with platinum below the midpoint of the COVID-era range and all the important moving averages.
Palladium remains weak after sliding to fresh 5-year lows two weeks ago. The next support level to watch is defined by a measuring objective and a Fibonacci level at $1088.38/$1085.50.
Non-Reliance and Risk Disclosure: The opinions expressed here are for general information purposes only and should not be construed as trade recommendations, nor a solicitation of an offer to buy or sell any precious metals product. The material presented is based on information that we consider reliable, but we do not represent that it is accurate, complete, and/or up-to-date, and it should not be relied on as such. Opinions expressed are current as of the time of posting and only represent the views of the author and not those of Zaner Metals LLC unless otherwise expressly noted.
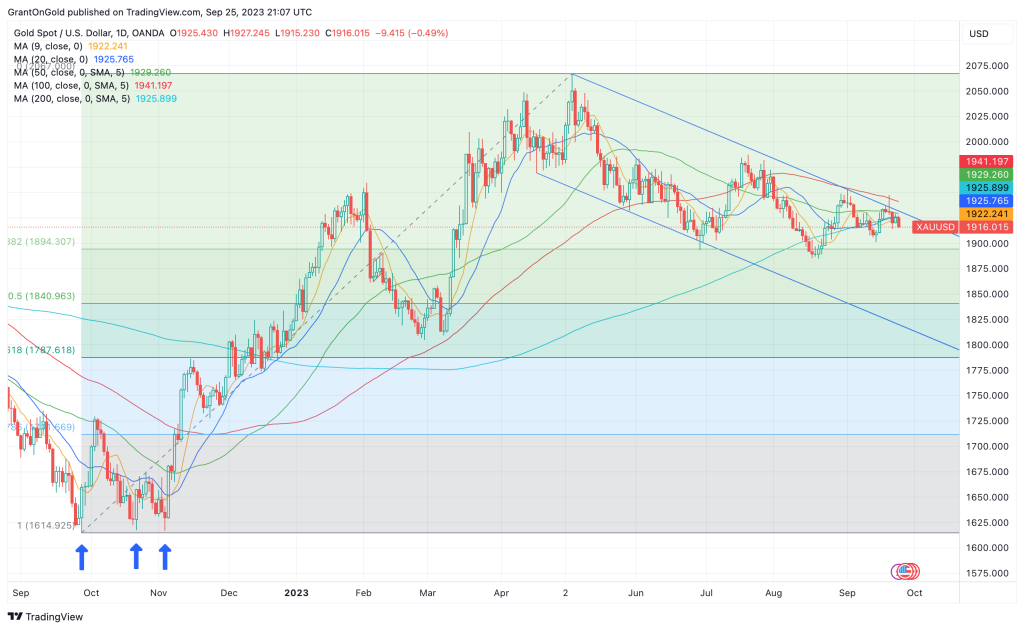
Gold continues to consolidate in the bearish channel that dominated throughout the summer. The 100-day MA successfully contained the upside last week, leaving the downside vulnerable to further tests.
Spot Gold Daily Chart through 9/25/2023
Last week the Fed held steady on rates, as was widely expected. However, Chairman Powell noted strength in the economy and his desire to see “convincing evidence” that inflation is moderating.
The dot plot suggested that at least one more rate hike could be seen this year. Perhaps more importantly, the dots reinforced the ‘higher for longer’ scenario with the first rate cut now forecast for June 2024.
The 10-year yield moved more convincingly above 4% on Monday, reaching levels not seen since 2007. Higher yields are buoying the greenback. The dollar index extended on Monday to reach 10-month highs.
Higher yields and a higher dollar will continue to pose a considerable headwind for gold. Mounting global growth risks apply additional weight.
It is believed that the Eurozone economy contracted in Q3, even as inflation remains elevated. September CPI is forecast to be 4.5%. While that’s down from 5.2% in August, the inflation rate remains well above target.
Earlier in the month, the ECB hiked rates for a 10th consecutive meeting, pushing the deposit rate to a record high of 4%. Analysts now believe the ECB is on hold, probably into next summer.
However, the ECB also will want to see some convincing evidence to confirm that inflation has been squelched in the EU. Until that happens, at least one more rate hike can’t be ruled out.
Of course, worries about the Chinese economy persist as well. This could have grim implications for the global economy.
Chinese demand for imports has contracted in nine of the last 10 months. If China slips into recession, there are concerns that demand for commodities will suffer further. While that may help tamp inflation, the demand destruction will be the greater concern in the medium term.
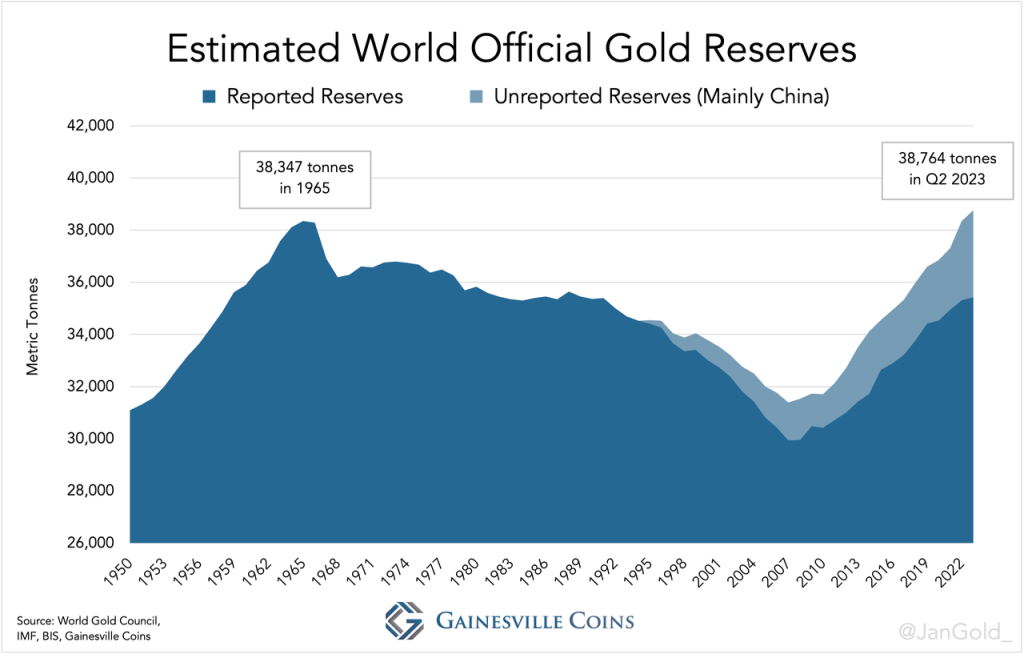
The ongoing expansion of official gold reserves remains a bright spot for the yellow metal. Central banks continue to seek diversification, mainly out of dollars and into gold.
While central bank gold demand slowed in Q2, the record purchases in Q1 led to record H1 demand of 387 tonnes. Turkey was a big seller in April and May before resuming purchases in June.
The World Gold Council believes the Turkish sales were “tactical rather than strategic” amid internal economic and political strife. Interestingly, as the TCMB was selling, demand for bars, coins, and gold jewelry surged in the country as citizens sought to protect their wealth against a devaluing lira.
Estimated World Official Gold Reserves
Taking into consideration estimates of China’s unreported gold reserves, analyst Jan Nieuwenhuijs of Gainesville Coins believes world reserves reached an all-time high of 38,764 tonnes in Q2. If that’s an accurate assessment, it exceeds the previous record of 39,347 tonnes from 1965.
Nieuwenhuijs points out that gold as a percentage of total global reserves currently stands at 17%, while the long-term historical average is 58%. That suggests there remains considerable potential for further central bank gold buying.
If gold were once again to make up the majority of global reserves, one of Jan’s models projects a price in excess of $8,000 over the next 10 years.
Silver
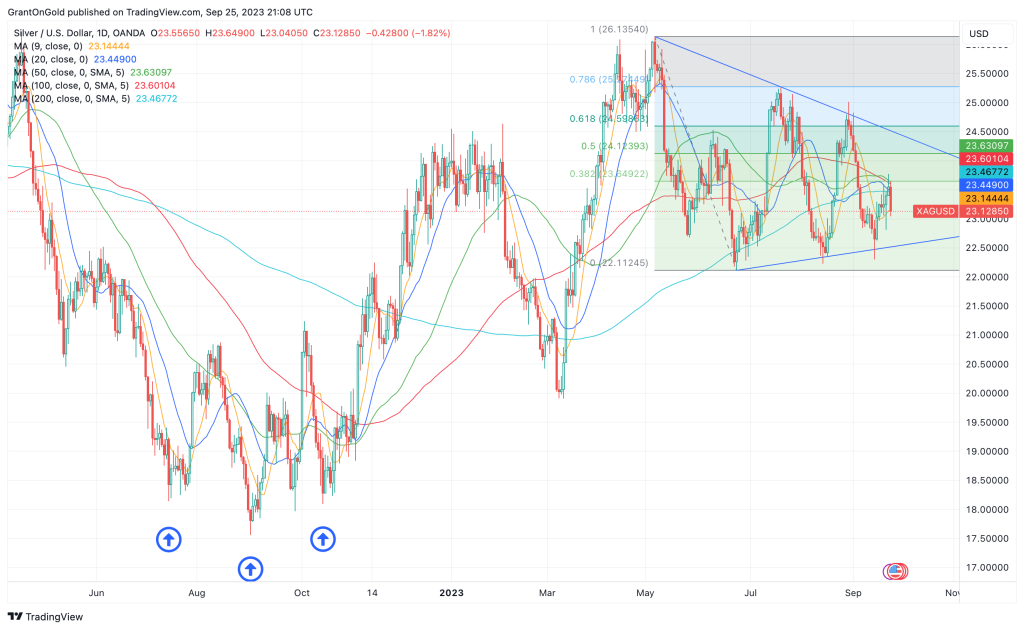
Silver continues to trade in a choppy manner within the confines of a large symmetrical triangle pattern. The white metal rose more than 2% last week, but most of those gains were given back on Monday.
Spot Silver Daily Chart through 9/25/2023
The silver market is facing some of the same headwinds as the gold market. Perhaps most notably, sluggish demand for electronics in China is likely to adversely impact demand for silver.
The Chinese auto sector returned to growth in August, after contracting in June and July. Sales surged 8.5% m/m and 2.2% y/y with electric vehicles such as Teslas increasingly popular. However, the sustainability of these gains is in doubt as China’s real estate crisis threatens to sap consumer demand.
Real estate is the biggest contributor to Chinese GDP, so the crisis has the potential to drag the middle kingdom into recession. Growth risks in the world’s second-largest economy pose considerable risks to the global economy as a whole.
That being said, the global trend toward electrification keeps the long-term supply/demand fundamentals undeniably positive. Therefore, retreats into the range that has emerged this year are still likely to be viewed as buying opportunities.
Initial support is well-defined by the series of lows at $22.30, $22.22, and $22.11. This zone should keep the low for the year at $19.90 (10-Mar) at bay.
Last week’s high at $23.78 is now seen as the trigger for a retest of the upper reaches of the triangle pattern, which comes in around $24.50.
PGMs
Platinum continues to struggle on upticks. The market rose modestly last week, notching a second consecutive higher weekly close. However, renewed selling pressure surfaced on Monday.
Spot Platinum Daily Chart through 9/25/2023
While U.S. auto sales were robust in August, global growth concerns continue to percolate below the surface. Rising interest rates also threaten to undermine consumer purchasing power.
Late-summer sales were helped by better supply, but if the expanding UAW strike persists the supply of new cars will tighten.
Palladium remains defensive at the low end of the multi-year range.
Non-Reliance and Risk Disclosure: The opinions expressed here are for general information purposes only and should not be construed as trade recommendations, nor a solicitation of an offer to buy or sell any precious metals product. The material presented is based on information that we consider reliable, but we do not represent that it is accurate, complete, and/or up-to-date, and it should not be relied on as such. Opinions expressed are current as of the time of posting and only represent the views of the author and not those of Zaner Metals LLC unless otherwise expressly noted.
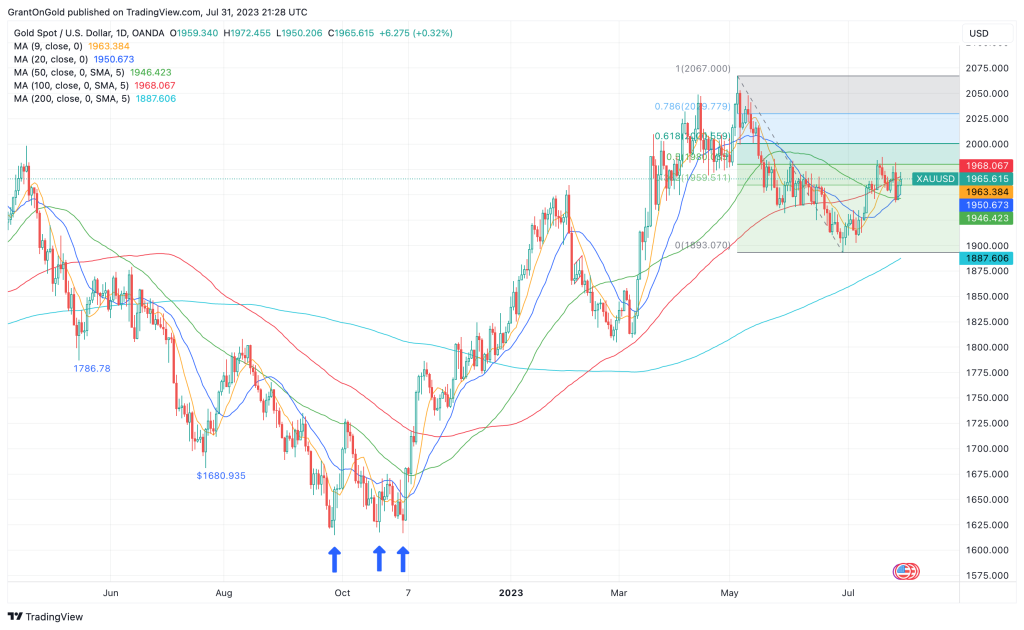
Gold is consolidative just below the midpoint of the May-June range as the market assesses the implications of last week’s Fed rate hike and better-than-expected economic data. The yellow metal ends July with a gain of 2.4%, breaking a 2-month losing streak.
Spot Gold Daily Chart through 7/31/2023
Last week the Fed hiked rates by 25 bps, and it was widely accepted it would be the last one for some time. However, on Thursday Q2 advance GDP came in at 2.4%, above expectations of 1.9%. In addition, durable goods orders surged 4.7% in June, well above market expectations of 1.8%.
These robust data are evidence that the U.S. economy continues to hum along at a respectable pace, despite the marked rise in interest rates over the past 16 months. More hawkish members of the Fed could now conceivably argue there is room for another rate hike. Fed funds futures are currently showing a 20% probability for a 25-bps hike in September.
While the Fed’s favored measure of inflation cooled to 4.1% in June, versus 4.6% in May, there are lingering worries in the market that a second wave of inflation could be in the offing. The national average for a gallon of regular gas jumped 13¢ last week reaching an 8-month high.
I’m often asked why gold didn’t fare better during this inflationary period. The answer lies in the Fed’s aggressive response in raising the Fed funds rate by 525 bps in just over a 1-year period. During that time, gold only corrected 22%, from $2070.63 (just shy of the all-time high) to $1614.92.
Most of those corrective losses have already been retraced, so I would argue that gold held up remarkably well in the face of the most aggressive tightening campaigns in recent history.
The long-term trend remains bullish with the market trading less than $110 off the all-time high. Setbacks into the range are likely to be viewed as buying opportunities.
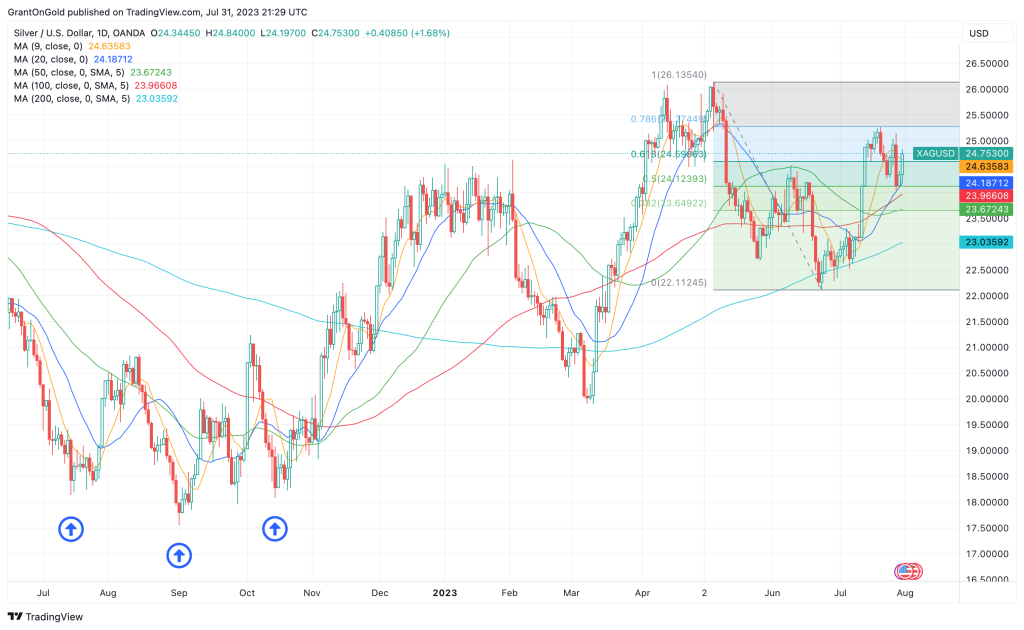
Silver
Silver closed down more than 1% last week, weighed by persistent concerns that the health of the Chinese economy, and an uptick in the probability of another Fed rate hike in September.
Spot Silver Daily Chart through 7/31/2023
A firmer tone emerged over the past two sessions on the heels of strong U.S. and Japanese data. While the Chinese economy continues to show signs of weakness, the government announced supports for light industry on Friday and then measures to boost consumer spending on Monday.
Such stimulus offers support for both precious and industrial metals. If the Chinese economy continues to struggle, additional (and larger) stimulus would be likely, providing underpinning for the metals.
I like that the 20-day SMA successfully contained the downside last week. Renewed tests above $25 would bode well for a retest of the high from July 20 at $25.27. Penetration of the latter would clear the way for a challenge of the highs for the year at $26.09/14.
PGMs
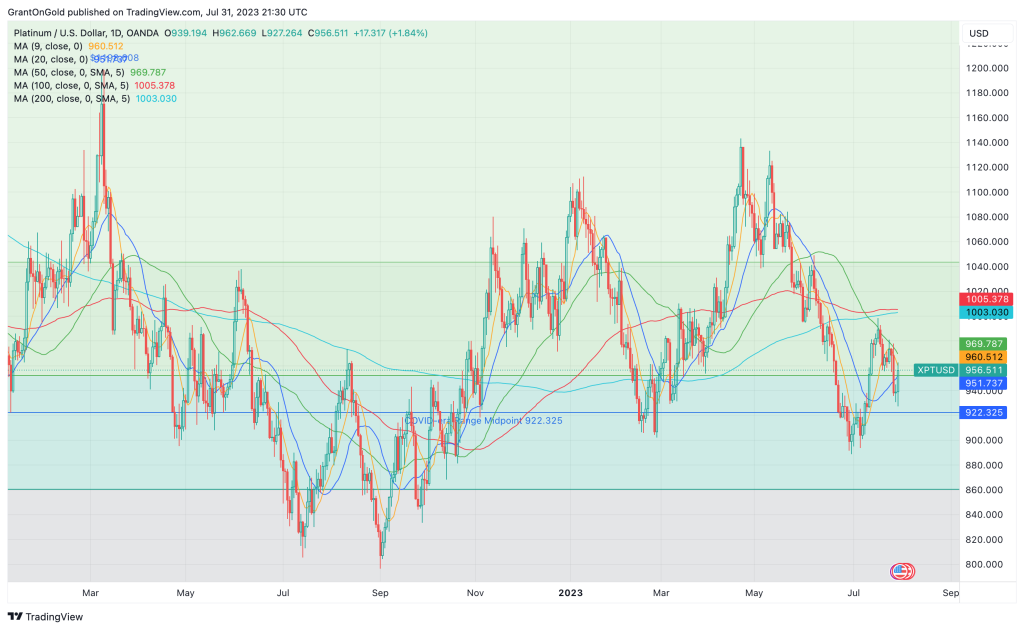
Platinum fell 2.8% last week, notching a second consecutive lower weekly close. A fresh 2-week low was set on Monday before the market snapped back to close nearly 2% higher on the day.
Spot Platinum Daily Chart through 7/31/2023
The outside day with a higher close bodes well for upside follow-through on Tuesday. Strong economic data from the U.S. and Japan, along with Chinese stimulus are supportive factors.
The longer-term supply and demand dynamics remain broadly supportive. Dips into the range are likely to be viewed as buying opportunities.
Palladium has been corrective to consolidative over the past several weeks. While a short-term bottom may be in place at $1185.18, the trend remains bearish.
Non-Reliance and Risk Disclosure: The opinions expressed here are for general information purposes only and should not be construed as trade recommendations, nor a solicitation of an offer to buy or sell any precious metals product. The material presented is based on information that we consider reliable, but we do not represent that it is accurate, complete, and/or up-to-date, and it should not be relied on as such. Opinions expressed are current as of the time of posting and only represent the views of the author and not those of Zaner Metals LLC unless otherwise expressly noted.
Gold jumped 1.5% last week, boosted by a weaker dollar. The dollar index collapsed to a more than 1-year low amid heightened expectations that the Fed’s tightening cycle is nearing its conclusion.
Spot Gold Daily Chart through July 17, 2023
One more 25 bps rate hike is widely anticipated when the FOMC meets next week. That would take the Fed funds rate to 5.25-5.50%. After that, Fed funds futures favor the central bank being on hold through the end of the year.
A report that the BRICS countries (Brazil, Russia, India, China, South Africa) planned to introduce a gold-backed currency at their August summit in South Africa added additional weight to the greenback and lift for the yellow metal. Such a currency would be a direct competitor to the dollar, perhaps hastening the de-dollarization of the global economy that is already underway.
The initial report came from state-run Russia Today (RT), so there are some questions as to its veracity. However, there has been talk of a BRICS currency for years.
While some of the BRICS nations have been aggressively accumulating gold in recent decades, there are some doubts as to whether they have enough to meaningfully back a reserve currency. I’d say that depends to a large degree on actual gold reserves as compared to reported reserves, as well as the underlying price of gold.
Official Gold Reserves of BRICS Nations (Tonnes) through Q1 2023
Country
Gold Reserves Tonnes
Gold Reserves as % of Total Reserves
Brazil
129.65
2.42%
Russian Federation
2,326.52
24.9%
India
794.62
8.66%
China
2,068.36
3.9%
South Africa
125.38
12.07%
*Data courtesy of World Gold Council
That’s a total of 5,444.53 tonnes of gold. That’s still well below reported U.S. reserves of 8,144.46 tonnes, not that gold provides any backing for the dollar. But it is widely believed that Chinese reserves are significantly underreported.
Some respected gold analysts think Chinese reserves may be as high as 30,000 tonnes! “The PRC probably has as much as 30,000 tonnes hidden in various accounts, but not declared as official reserves,” said Alasdair McLeod Head of Research at GoldMoney.
Ross Norman has quipped, “Put an additional zero on the end” of reported Chinese gold reserves and it will get you closer to reality.
I suspect the gold holdings of the Russian Federation are underreported as well. Meanwhile, the Indian government continues to work relentlessly to monetize the estimated 25,000 tonnes of gold held by Indian households, despite past failures to do so.
The expansion of U.S. trade sanctions against Russia, Venezuela, and others have sparked interest in a BRICS currency from all corners of the globe. Algeria, Argentina, Bahrain, Bangladesh, Egypt, Ethiopia, Indonesia, Iran, Audi Arabia, and the UAE have recently applied for membership in BRICS. Nearly two dozen more have expressed an interest in joining.
There’s a lot of gold potentially in play, beyond just reported reserves of the current BRICS members.
Developing a stable monetary union among such a diverse group is a daunting task. At a minimum, syncing monetary, economic, and fiscal policies will be a long and undoubtedly bumpy road.
However, if such a currency is indeed to be backed by gold, it seems likely that BRICS members, and potential future members, would be well served by accumulating as much gold as they possibly can.
Such a strategy does not bode well for fiat currencies, including those of BRICS members. However, the dollar may be the most vulnerable as members and potential members seek to diversify their reserve holdings out of greenbacks.
Gold is presently trading less than 6% off its all-time high against the dollar. It’s less than 10% off the all-time highs against the euro and pound, and about 12% below its record high against the Swiss franc.
Diversifying your own reserve holdings out of dollars seems a prudent strategy. The recent corrective consolidation phase in gold suggests the dominant uptrend may not be over yet. In addition, the recent plunge in premiums makes buying physical metals even more appealing.
A rebound above $1983.50 would bode well for renewed tests above $2000. Once the latter is regained, I’d be feeling pretty confident about new record highs.
Silver
Silver surged 8% last week to set a 9-week high just below $25. It was the third consecutive higher weekly close.
Spot Silver Daily Chart through July 17, 2023
Weaker-than-expected inflation data and a decent payrolls number for June build a strong case for a Fed pause after the July FOMC meeting. That suggests there is a chance the U.S. will avoid recession, which bodes well for commodities.
Economist Nomi Prins believes the upcoming BRICS summit and the prospect of a serious challenge to dollar hegemony is a threat to the greenback and to the U.S. treasury market. Not a good scenario given the massive and growing size of our national debt. This may prompt hedge funds to sell dollars and buy gold and silver.
More than 61.8% of the April to June decline has already been retraced and silver is back above all of the critical moving averages. A trade above $25 would clear the way for a retest of the $26.08/14 highs from April and May.
An eventual penetration of the latter would put silver back on track for a challenge of the important $30 zone.
PGMs
The weaker dollar, the anticipated end of Fed tightening, and the prospects for a soft landing have helped buoy platinum, resulting in a gain of 7% last week. A short-term rise above $1000 would favor additional retracement toward resistance at $1046/$1049.
Spot Platinum Daily Chart through July 17, 2023
Palladium remains defensive near 4½-year lows, weighed by dimmed auto-sector demand prospects as the desire for EVs grows and platinum for palladium substitution in autocats persists.
Non-Reliance and Risk Disclosure: The opinions expressed here are for general information purposes only and should not be construed as trade recommendations, nor a solicitation of an offer to buy or sell any precious metals product. The material presented is based on information that we consider reliable, but we do not represent that it is accurate, complete, and/or up-to-date, and it should not be relied on as such. Opinions expressed are current as of the time of posting and only represent the views of the author and not those of Zaner Metals LLC unless otherwise expressly noted.
With the significant jump in the US dollar at the end of last week, a new high in the dollar this morning, a slight rise in US interest rates, and softer-than-expected Chinese new loan data last week, the commodity markets are facing signs of slowing instead of signs of out-of-control inflation.
Fortunately for the bull camp, the recent correction in gold prices prompted fresh buying interest in India after seeing those buyers back off with prices above $2,020.
Unfortunately for the bull camp, soft US scheduled data, strength in the dollar and global economic slowing fears leaves global gold demand expectations disappointing and leave the bear camp with an edge with respect to demand fundamentals...[MORE]
Please subscribe to receive the full report via email by clicking here.
In our opinion, the gold market has probably forged an intermediate top with a major blowoff range-up reversal overnight. In other words, optimism about the potential for an end to the US rate hike cycle has been embraced and perhaps overdone.
From a fundamental perspective, Indian gold prices posted a record high overnight and in the past Indians have been very price conscious which in turn could result in a near-term demand void.
However, the gold market should be supported by another inflow to gold ETF holdings of 24,688 ounces yesterday as that narrows the year-to-date decline in holdings to only 0.2%...[MORE]
Please subscribe to receive the full report via email by clicking here.
With the dollar forging a 3-day low early today the gold trade looks to have a modest cushion against the prospects of selling from official confirmation of a US rate hike later today.
At times yesterday, gold and silver prices diverged, with gold remaining consistently in favor in a possible sign of the entrenched flight to quality interest from both economic and political uncertainty.
In fact, news that Iran has seized an oil tanker in the Straits of Hormuz adds an additional measure of political uncertainty to the gold trade today...[MORE]
Please subscribe to receive the full report via email by clicking here.