• +1 (312) 549-9986

Gold $2,332.43 $(7.5) -0.32% Silver $27.28 $0.06 0.22% Platinum $923.56 $9.43 1.03% Palladium $962.48 $8.12 0.85%
RSS

Blog posts tagged with 'economy'

Grant on Gold – April 17, 2023
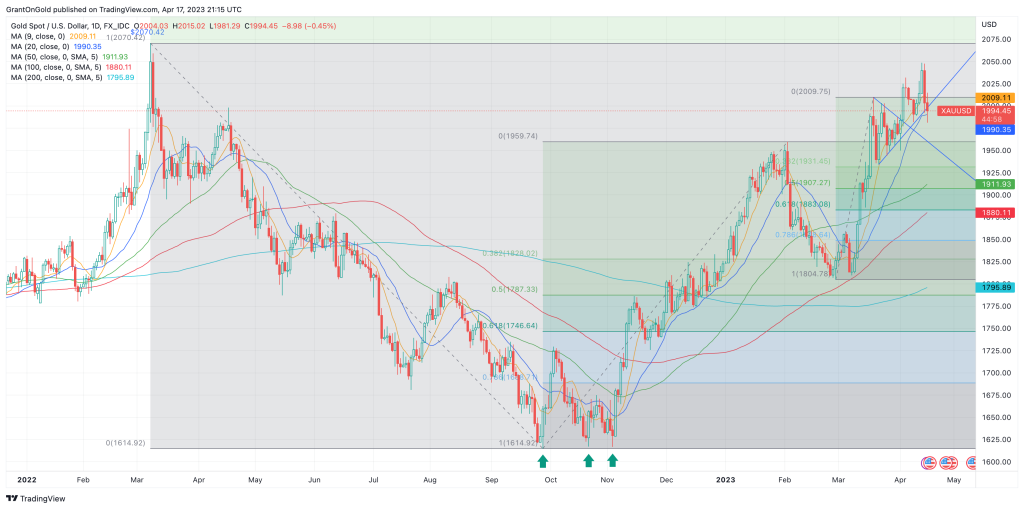
Monday, April 17, 2023

Gold closed down 0.2% last week but not before a new 13-month high was attained at $2048.79. A corrective tone persisted early in the new week amid speculation that the Fed will hike rates again in May, even as inflation continues to slow.

Spot Gold Daily Chart through 4/17/23

Both CPI and PPI came in below expectations in March. PPI posted its biggest monthly decline since April 2020.  With inflation concerns waning, so too does a significant bullish catalyst.

Nonetheless, there is a growing expectation that the Fed will hike interest rates at the May FOMC meeting. Based on the CME’s FedWatch tool, the probability of a 25-bps hike now stands at 91%, that’s up from 72.2% last week and 20.7% a month ago.

Assuming the Fed does indeed tighten in May to the 5.00-5.25% range, the market believes they will hold steady in June. There is however an 18% probability of another 25-bps high in June.

Keep an eye on EU and UK inflation data this week. Hot numbers would likely prompt the respective central banks to maintain their bias toward tighter policy with the potential to further narrow interest rate differentials.  

Providing some additional weight on gold is the fact that the dollar held a significant support level. The low from February 2 in the dollar index at 100.82 was ever-so-slightly exceeded on Friday last week but may be considered technically intact.

Dollar Index Daily Chart through 4/17/23

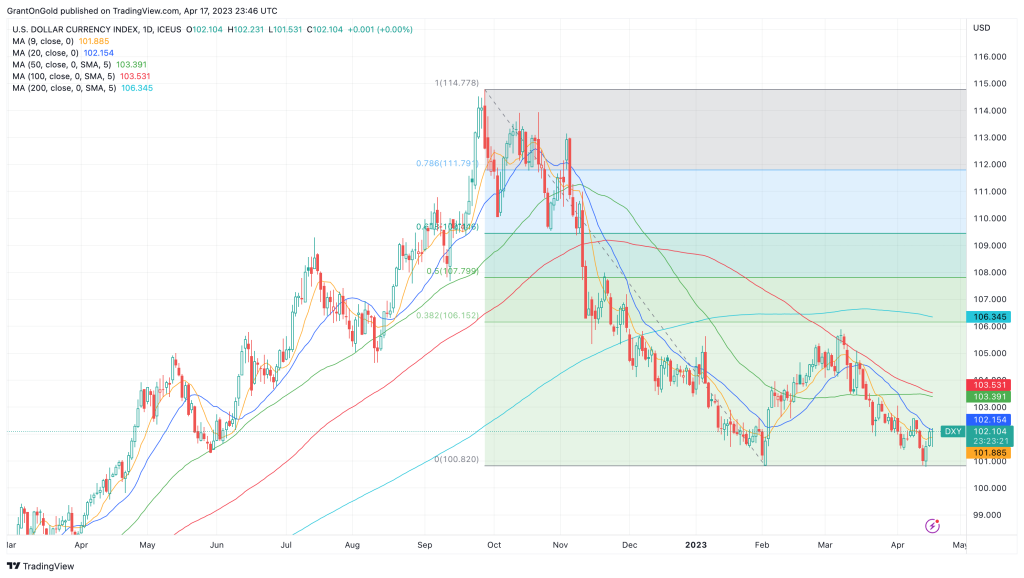
While the subsequent rally hasn’t been terribly impressive, a case can be made for a potential double-bottom. The confirmation point for that pattern is the 105.88 high from March 8, which is not in any immediate jeopardy.

The dollar has pressured its 20-day SMA already and penetration would clear the way for additional gains toward the 103.50 zone, where the 100 and, 200-day SMAs converge with the 50% retracement level of the latest leg down.

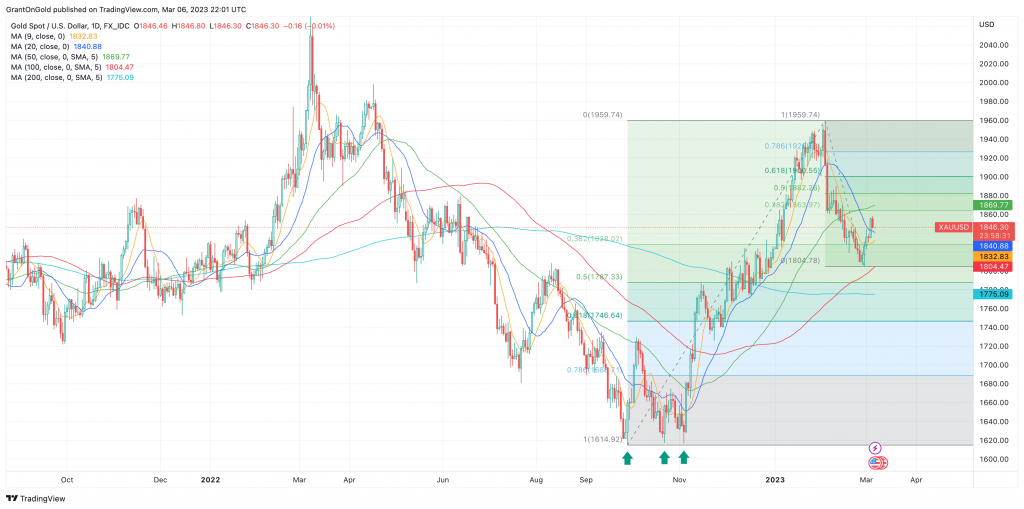
Such gains in the greenback would likely keep the pressure on gold. Short-term potential is back to the $1959 level, but such a move would be seen as corrective. My sense is that there are quite a few interested buyers feeling the market got away from them.

While there are reports that the recent higher prices have tamped Asian demand, I still believe there is potential for a near-term challenge of the all-time high at $2075.14.

Global gold ETF inflows were 164,805 ounces last week. It was the fifth consecutive weekly inflow, but holdings are still 0.3% lower YTD. We’ll be watching closely to see if more buyers come in on the break or if the recent longs are weak.

Silver

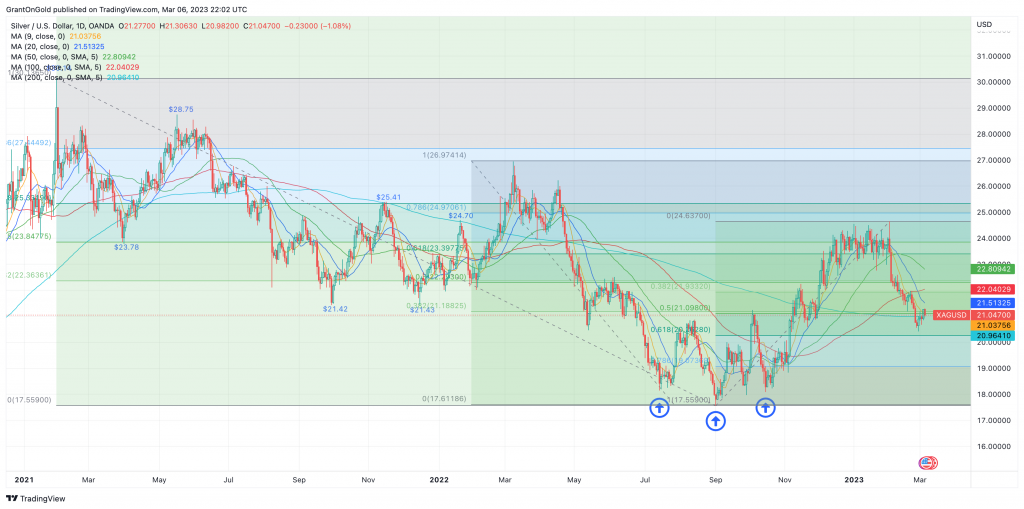
Silver gained 1.6% last week, it was the fifth consecutive high weekly close for the white metal, which probed above $26 for the first time since April of last year.

Spot Silver Daily Chart through 4/17/23

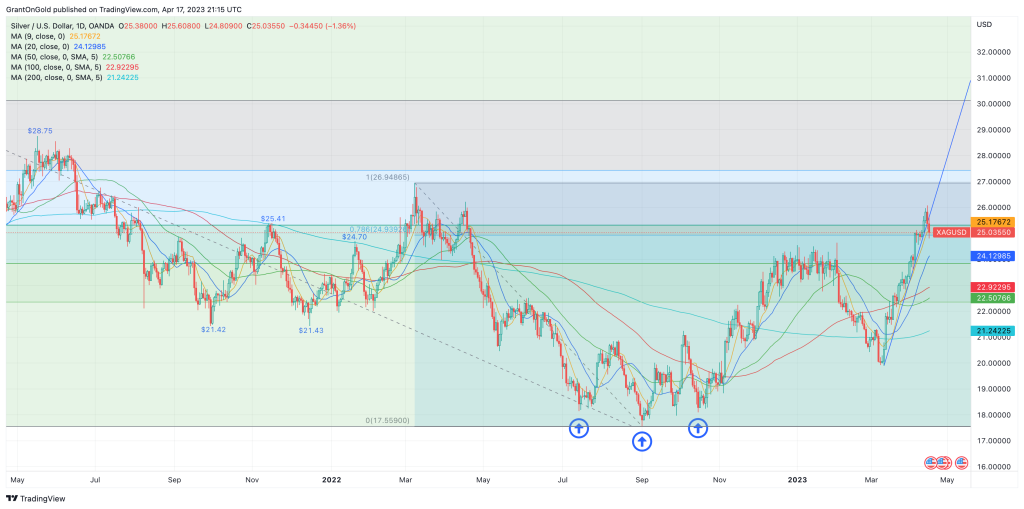
A softer tone prevailed on Friday into Monday, taking out nearby trendline support. Scope is seen for additional short-term losses back to the 20-day SMA at $24.25. Secondary support is marked by the 38.2% retracement level of the recent leg higher at $23.72.

The IMF now forecasts global growth of 2.8% in 2023, down from 3.4% in 2022. They believe China and India will account for more than half of that growth.

The IMF then sees the global economy averaging around 3% growth over the next 5 years. That’s well below the 3.8% average that was achieved in the previous 20 years.

That outlook doesn’t bode terribly well for industrial metals, and yet I suspect much of the growth that is realized will be driven by technology and the strong trend toward electrification. Silver should fare well in such an environment, even if the overall pace of global growth is weak.

Last week the Biden administration announced a plan to significantly increase vehicle emission standards beginning with the 2027 model year, projecting that 2/3rds of all vehicles sold in the U.S. would be EVs by 2032. That’s less than 10 years from now!

Whether such lofty goals are even remotely feasible remains to be seen, but it does seem likely that EVs will continue to gain market share. On average, EVs contain about 44% more silver and 2.5 times more copper than conventional vehicles.

PGMs

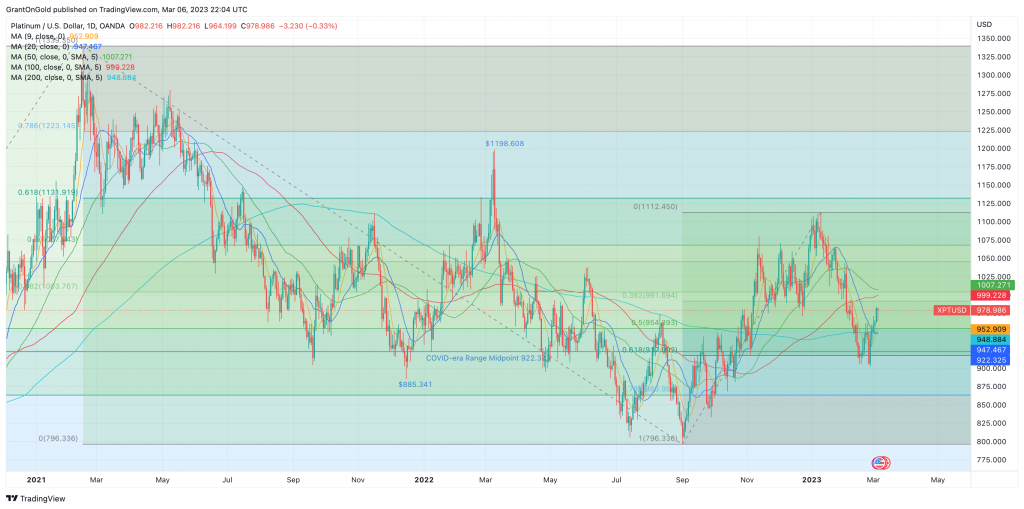
Platinum posted a 4% gain last week, notching a fifth consecutive higher weekly close. While gold and silver were defensive to start the week, both platinum and palladium displayed some buoyancy on Monday.

Spot Platinum Daily Chart through 4/17/23

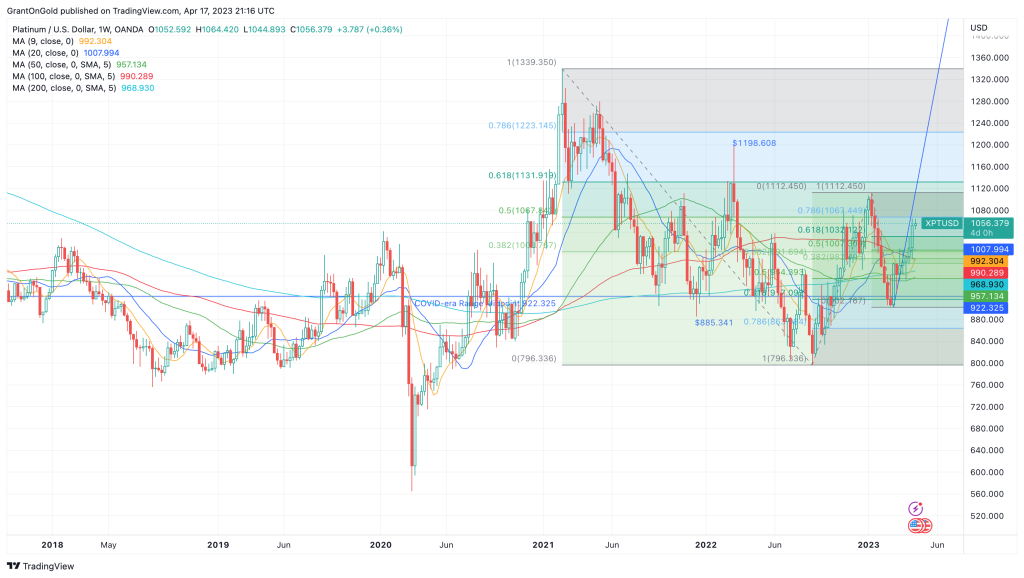
While platinum remains well within its range, the recent strength seems to defy the tepid global growth prospects and the Biden administration’s push to get rid of most vehicles powered by internal combustion engines.

Fewer ICE vehicles will ultimately result in diminished demand for auto catalysts. However, the market may have latched on to the expectation that emission standards will continue to be more stringent in the intervening years, requiring greater PGM loading.

Palladium has rallied about 18% since the $1329.18 low was set on March 9. A move above the 100-day SMA at $1612.66 would suggest potential back to $2000.


Non-Reliance and Risk Disclosure: The opinions expressed here are for general information purposes only and should not be construed as trade recommendations, nor a solicitation of an offer to buy or sell any precious metals product. The material presented is based on information that we consider reliable, but we do not represent that it is accurate, complete, and/or up-to-date, and it should not be relied on as such. Opinions expressed are current as of the time of posting and only represent the views of the author and not those of Zaner Metals LLC unless otherwise expressly noted.

Grant on Gold – March 6, 2023
Sunday, March 5, 2023

Gold ended last week with a gain of 2.5%. It was the first higher weekly close in 3 weeks.

Spot Gold Daily Chart through 3/6/23

The outside week (lower low, higher high) has some bullish technical implications, but the market failed to generate any upside follow-though on Monday. Traders are exhibiting caution ahead of Fed Chairman Powell’s testimony this week before Congress, and February jobs data that comes out on Friday.

While Powell is likely to highlight recent successes in tempering inflation, higher prices in January will likely prompt him to reiterate the need for ongoing tight monetary policy. Markets will hope to hear some optimism about Fed efforts to orchestrate a soft landing.

Much of that optimism stems from persistent strength in the jobs market, particularly after the huge payrolls beat in January.  Median expectations for February nonfarm payrolls are +223k. That’s less than half of January’s payrolls increase of 517k, but still a pretty respectable number.

Powell’s tenor and the jobs report should set gold’s short-term tone heading into the next FOMC meeting on March 21-22. While a 25-bps hike is still favored (68.6%), the probability for a 50-bps hike continues to edge higher, and now stands at 31.4% versus 24% last week.

The gold market’s focus remains squarely on the ebb and flow of monetary policy expectations, and the resulting movements in interest rates and the dollar. However, if it becomes evident that rate hikes alone can’t contain inflation, gold may rally on flight to quality in anticipation of stubborn inflation and heightened risks of a recession.

The bulls continue to pay considerable attention to feverish central bank gold demand, which reached a record 1,136 tonnes in 2022. This year is off to a good start with 31 tonnes of gold purchased by central banks in January. Turkey and China were notable buyers.

Reserve diversification, primarily out of dollars and Treasuries, appears to be the primary motivation for this gold buying. The rise in the use of sanctions also has many countries concerned about the liquidity of their reserve assets so they are shifting to something that is supremely liquid and tends to perform well in times of economic and geopolitical uncertainty.

Individual investors should consider following their lead.

Silver

Silver rebounded 2.5% last week, ending the string of lower weekly closes at six. While a simple hook reversal is evident on the weekly chart, the lack of upside follow-through on Monday suggests the downside remains vulnerable.

Spot Silver Daily Chart through 3/6/23

Like gold, silver adopted a consolidative tone on Monday as the markets eagerly await Powell’s initial testimony before the Senate Banking Committee on Tuesday. He’ll be back on the Hill on Wednesday to testify before the House Financial Services Committee. After that, the focus will shift to Friday’s jobs report.

Silver is likely being weighed to some degree by disappointment that China failed to announce a major stimulus program at the beginning of the National People’s Congress in Beijing.

China is targeting “around 5%” growth in 2023 but will apparently rely on a consumer-driven rebound. That’s only a modest increase over the 3% growth seen in 2022, which was the lowest GDP reading since 1976.

There are worries that without an influx of stimulus, Chinese consumers will remain cautious. Demand for consumer electronics and electric vehicles – which contribute significantly to silver demand – would likely remain soft.

Kitco reported on Monday that for the first-time auto manufacturers were at the BMO Global Metals, Mining, & Critical Minerals Conference. The implication is that auto companies might be interested in making moves to bolster their supply chains. That could include buying silver mines.

“If I were Elon Musk, I’d be very active in this area.” – Keith Neumeyer of First Majestic Silver

Neumeyer cited Silver Institute data that projects a 200 Moz deficit in the silver market this year, driven largely by heightened demand from both the auto and solar sectors. He went on to project a silver price north of $100 in the medium to long term.

PGMs

Platinum surged 8.3% last week, snapping a 7-week losing streak. A key reversal formed on the weekly chart, suggesting potential for short-term tests back above $1000.

Spot Platinum DailyChart through 3/6/23
Spot Platinum Daily Chart through 3/6/23

We may see some consolidation ahead of Powell and the jobs data, and the lack of Chinese stimulus does not help the bullish cause. However, a better technical picture has developed.

Palladium remains defensive just off the nearly-3½-year low set late in February at $1353.04.


Non-Reliance and Risk Disclosure: The opinions expressed here are for general information purposes only and should not be construed as trade recommendations, nor a solicitation of an offer to buy or sell any precious metals product. The material presented is based on information that we consider reliable, but we do not represent that it is accurate, complete, and/or up-to-date, and it should not be relied on as such. Opinions expressed are current as of the time of posting and only represent the views of the author and not those of Zaner Metals LLC unless otherwise expressly noted.