Grant on Gold – July 24, 2023
Monday, July 24, 2023Gold’s focus this week is squarely on the FOMC meeting. The two-day meeting begins on Tuesday with the policy announcement and Chairman Powell’s press conference set for Wednesday.
In the eyes of the market, a 25-bps rate hike is a foregone conclusion. Fed funds futures reflect a probability of 98.3%. That is largely the result of the ongoing tempering of U.S. inflation data.
June CPI data showed a full-point drop in annualized consumer inflation to 3.0% from 4.0% in May. June PPI fell to 0.1% y/y, versus a downward revised 0.9% y/y in May.
The market is widely anticipating that Fed will pause after this week’s hike. The target rate is then most likely to remain at 5.25% – 5.5% into Q1-2024. However, the policy statement will undoubtedly state that the rate path will be data-dependent.
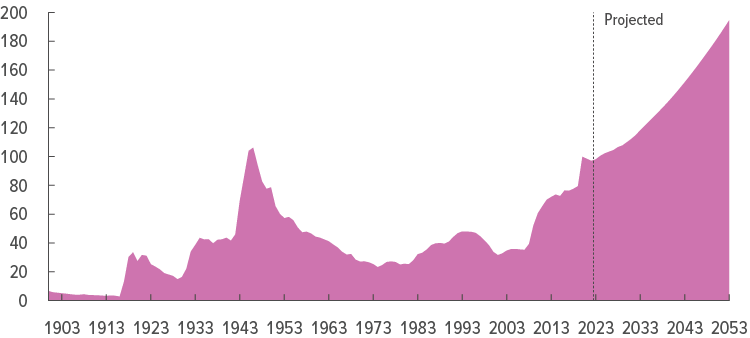
What comes next though? Arguably growth risks remain in light of the rather dramatic series of rate hikes over the past 16 months. On the other hand, Vincent Deluard of StoneX believes we “should brace for second and third inflationary waves, as was the case in the 50s and 70s.”
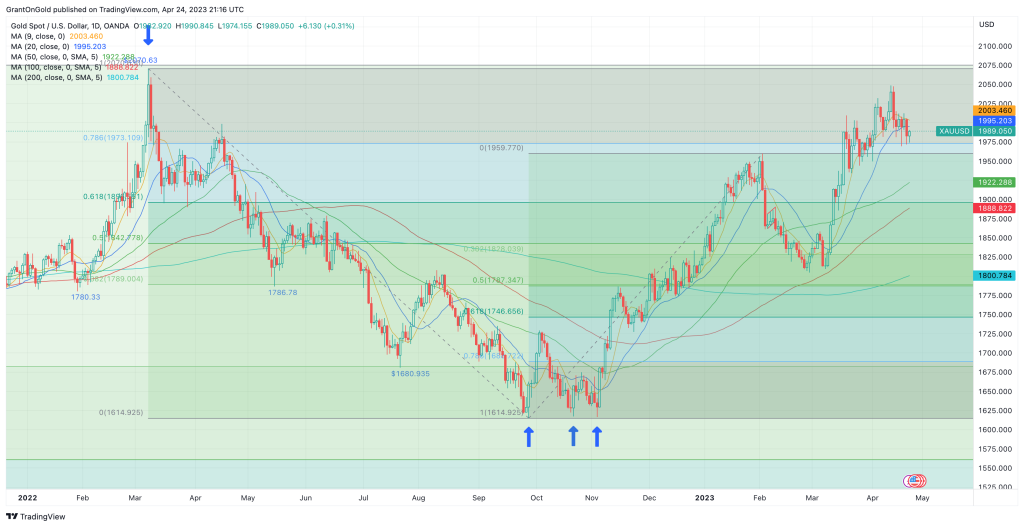
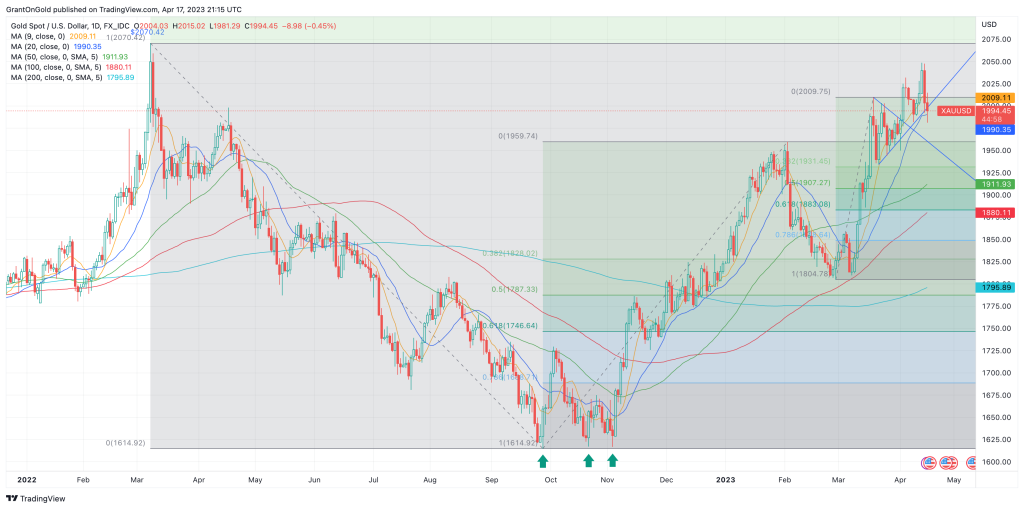
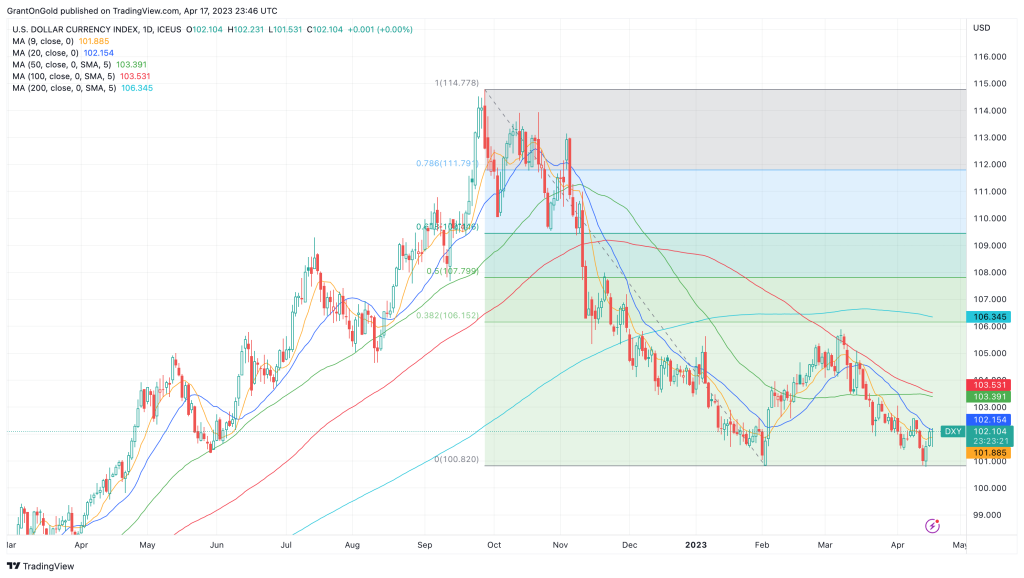
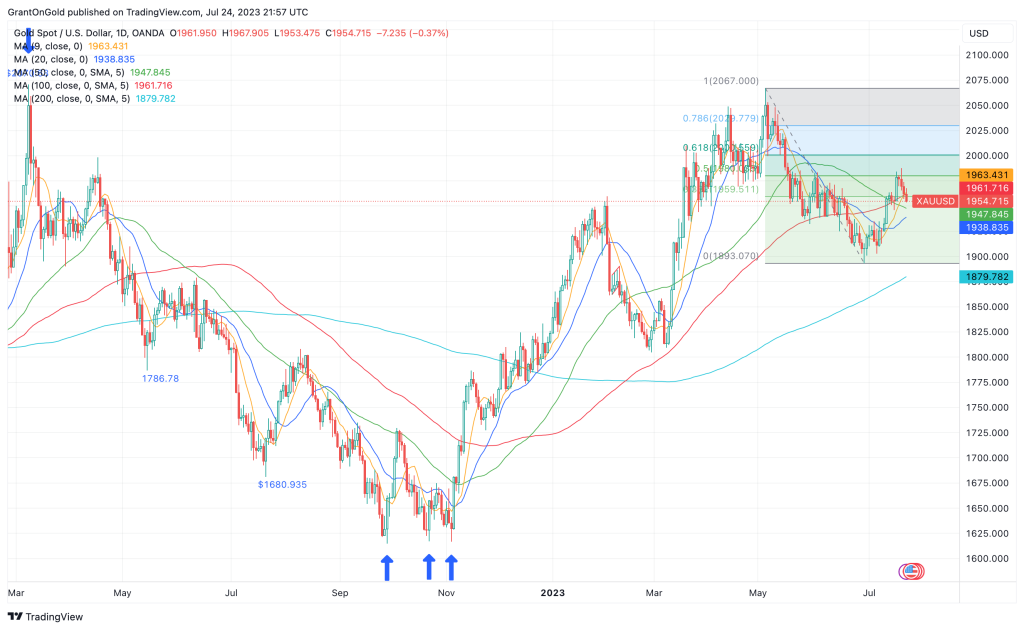
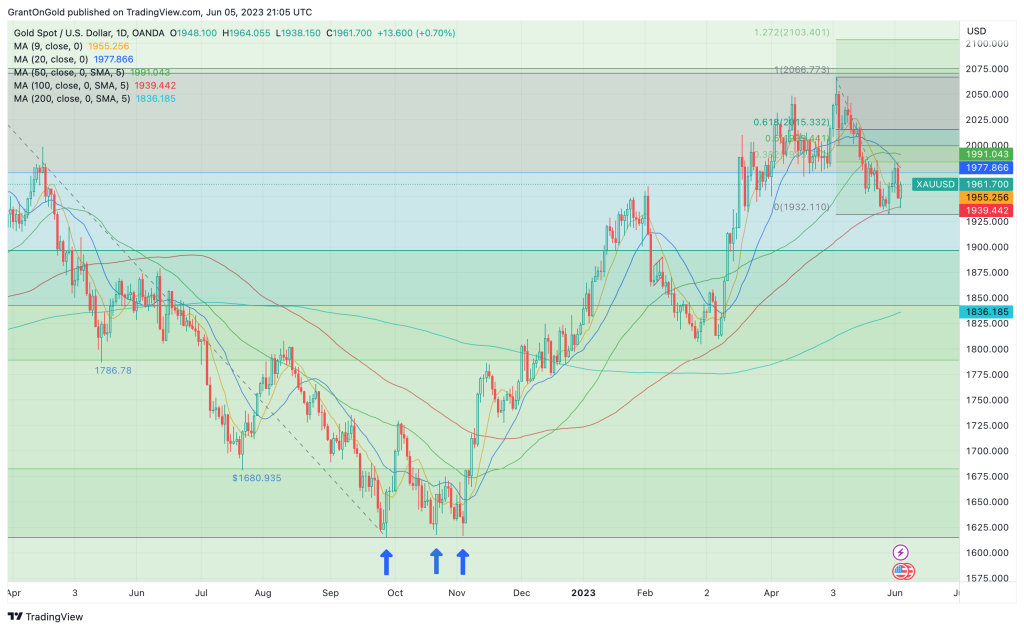
The yellow metal set a 9-week high last week shy of the $2000 level, buoyed by a weaker dollar. The dollar index tumbled to a 15-month low on the belief that the Fed is on the verge of pausing, while other major central banks will continue their tightening campaigns.
While gold and the dollar have adopted corrective tones in more recent sessions, I see this as primarily associated with position squaring ahead of the Fed decision. If the policy statement is in line with expectations – without an over-the-top emphasis on data dependency – the dominant trends should resume.
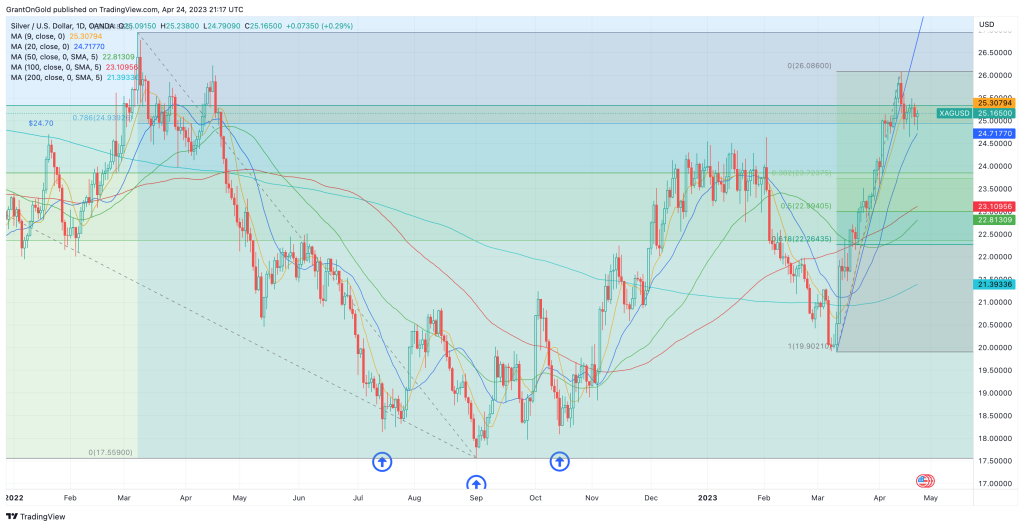
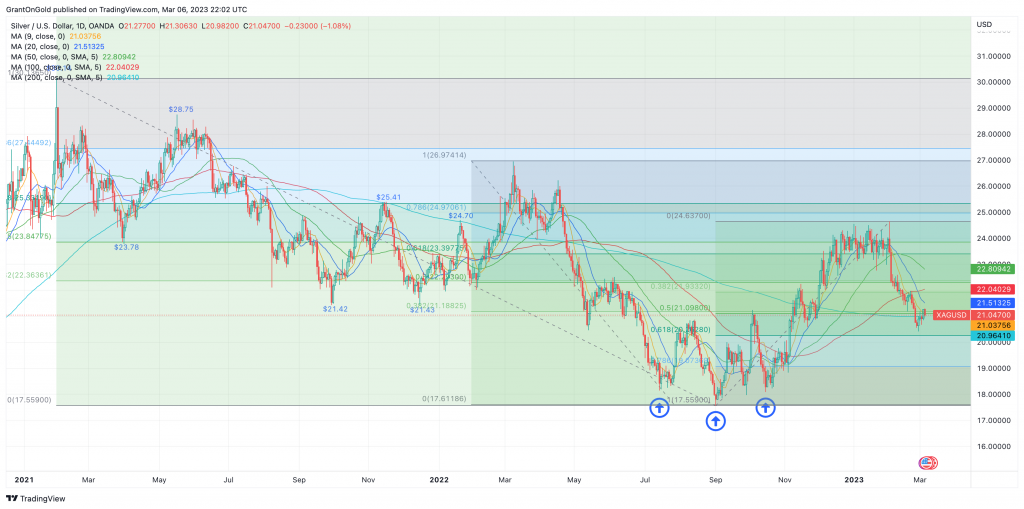
Silver
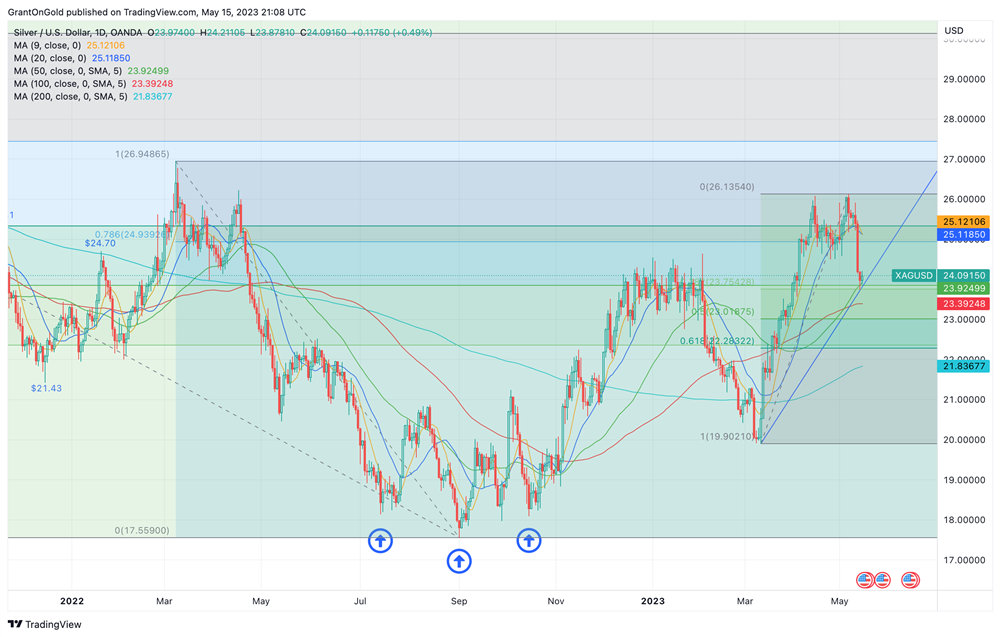
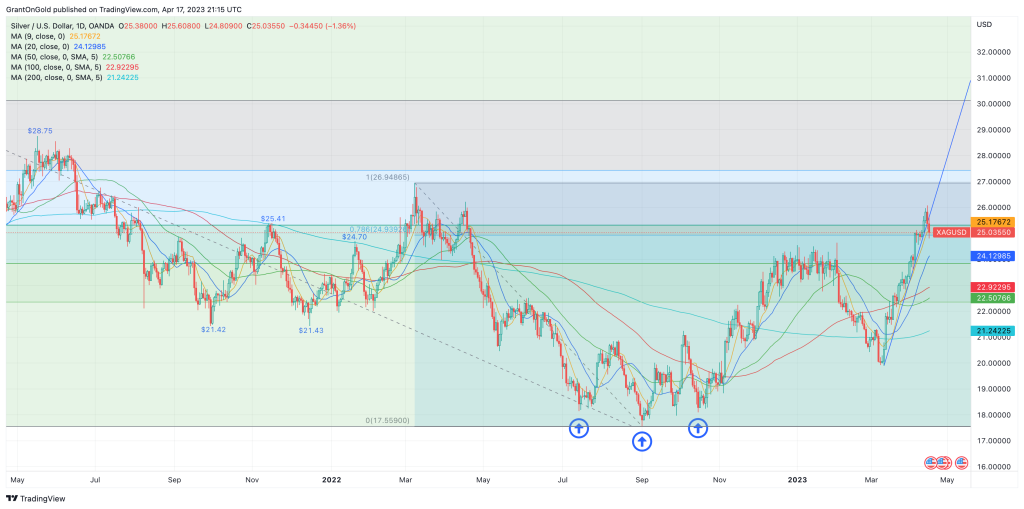
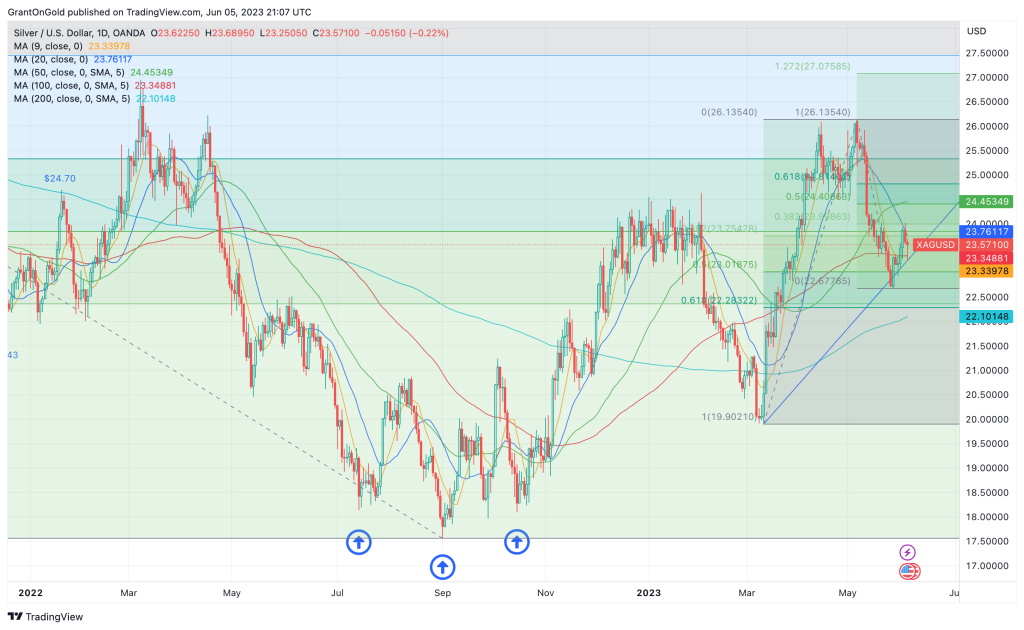
Silver closed down 1.3% last week. It was the first lower weekly close in four.
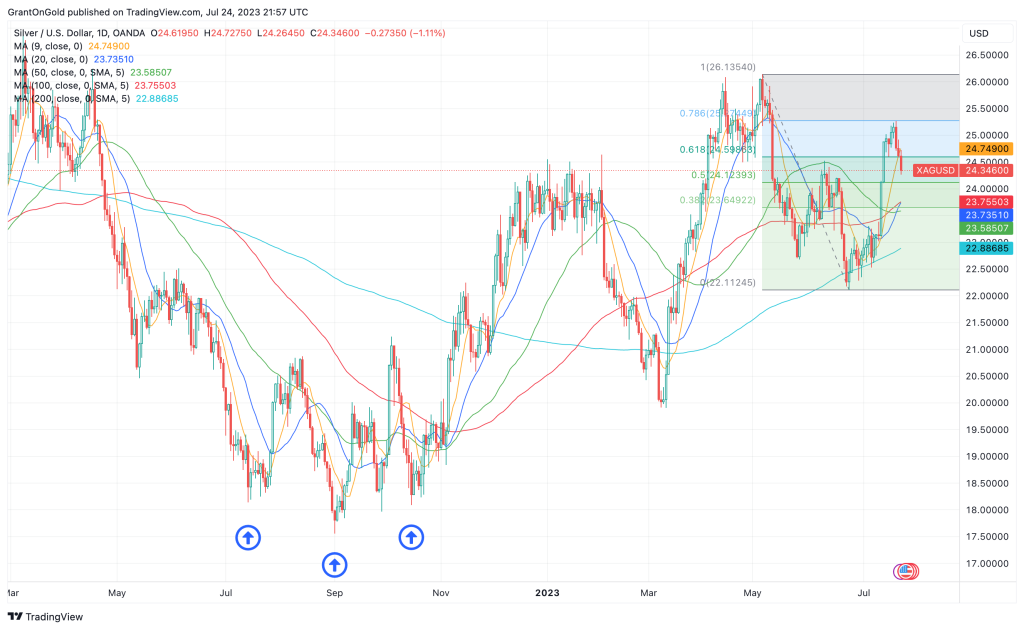
A key reversal did form on Thursday last week, so it was not surprising to see downside follow-through late last week and into Monday. Here too, we suspect some profit-taking ahead of the FOMC meeting.
Heightened growth risks may be putting some pressure on the more industrial metals as well. Preliminary US manufacturing PMI for July came in better than expected at 49, but the indicator appears on track for a third consecutive month of contraction.
Meanwhile, services PMI slumped to 52.4, well below expectations of 54. It was the sixth straight month of expansion, but the slowest pace since March.
According to the report: “The overall rate of output growth, measured across manufacturing and services, is consistent with GDP expanding at an annualized quarterly rate of approximately 1.5% at the start of the third quarter. That’s down from a 2% pace signaled by the survey in the second quarter.”
While economic growth slowed in July, there are plenty clinging to the notion of a soft landing. Let’s just say that my confidence in the Fed’s ability to orchestrate such an outcome is not particularly high.
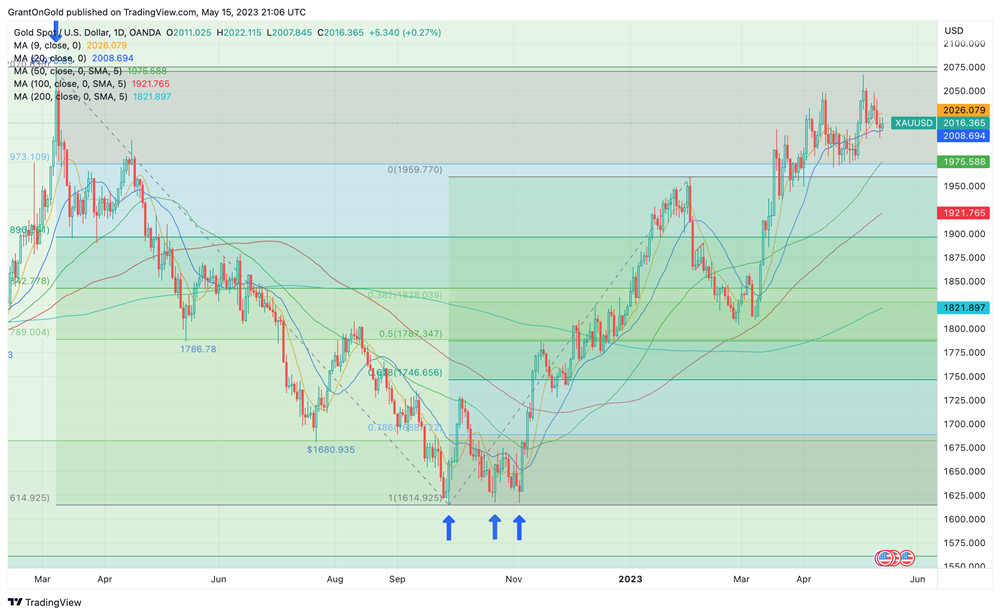
I’m also somewhat concerned about the ongoing lack of investor interest, despite the (near-perfect) 78.6% retracement of the May-June decline. ETF outflows last week totaled 6.4Moz, leaving net holdings down more than 2% YTD.
The longer-term supply/demand fundamentals remain broadly favorable, and setbacks are likely to be viewed as buying opportunities.
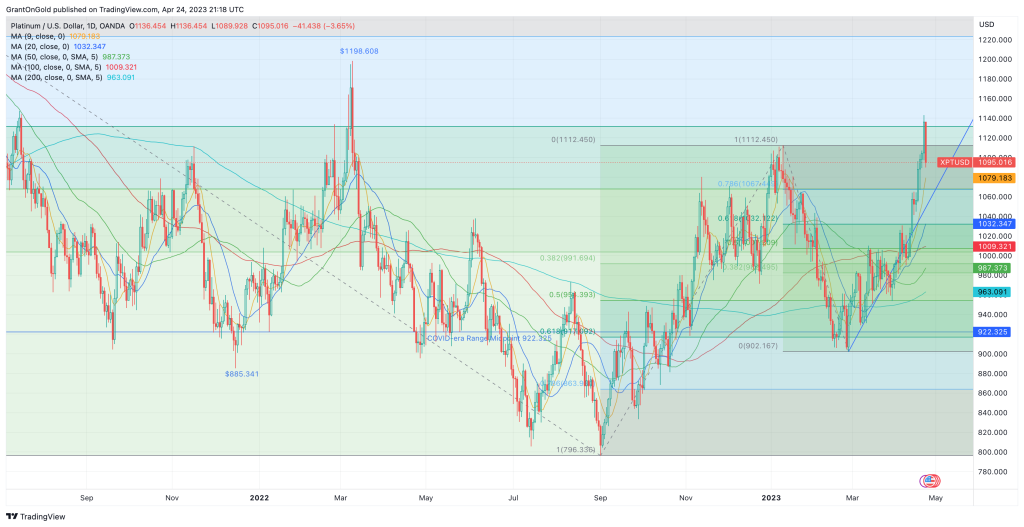
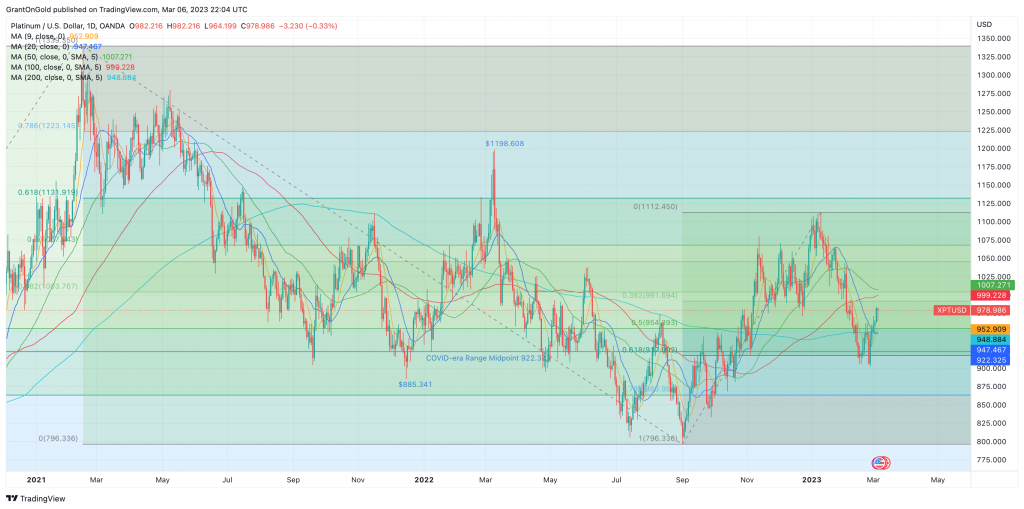
PGMs
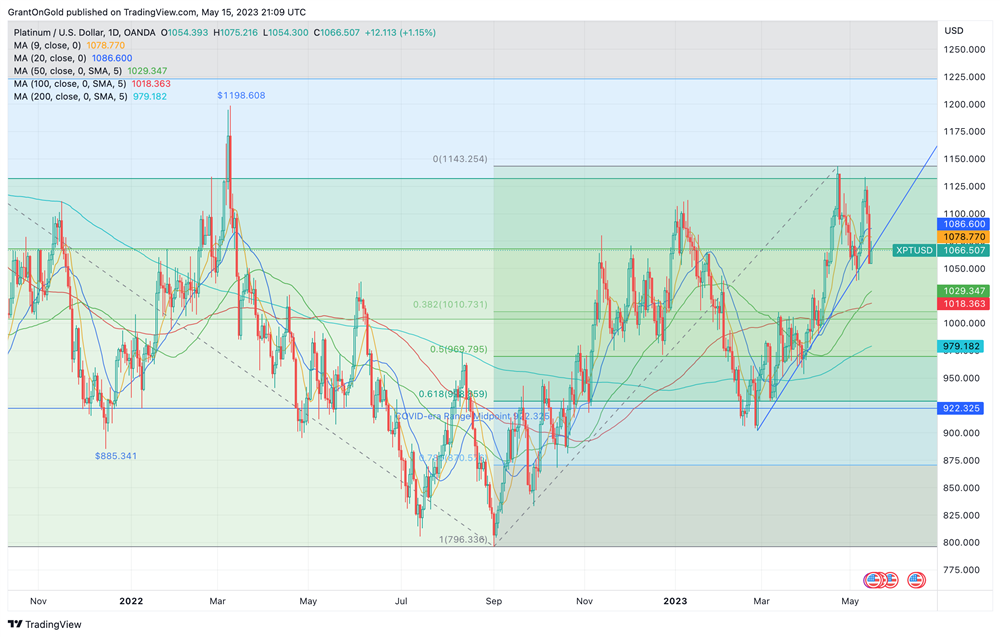
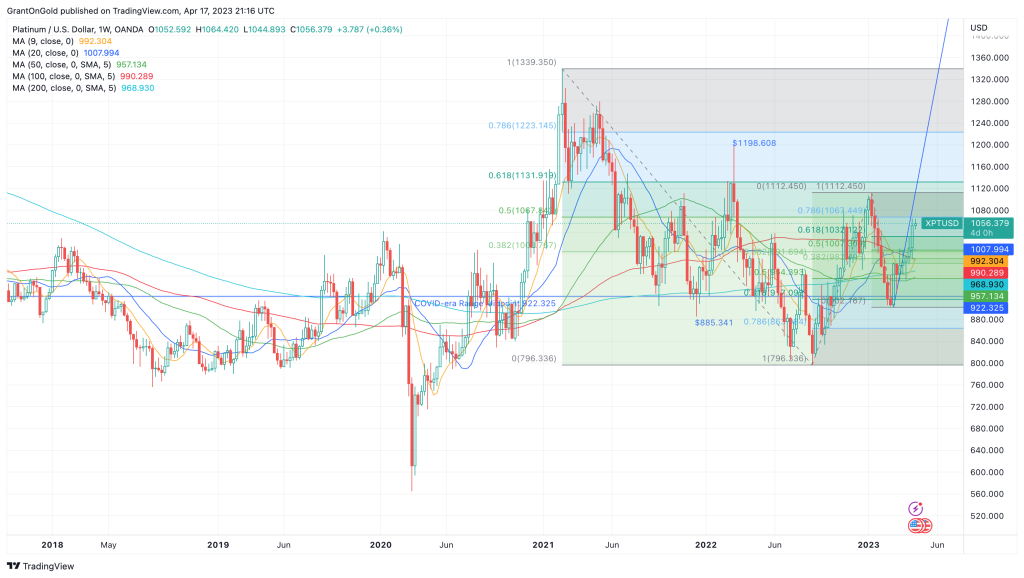
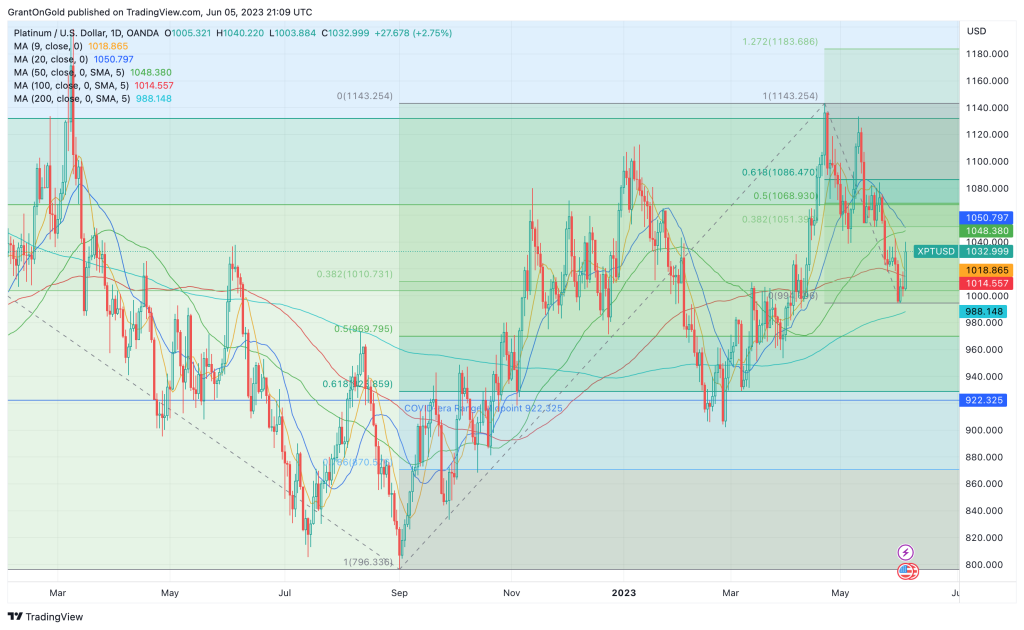
Platinum fell 1.1% last week but not before establishing a 5-week high at $998.43. The inability of the market to regain $1000 leaves the upside limited while the market awaits the Fed’s decision.
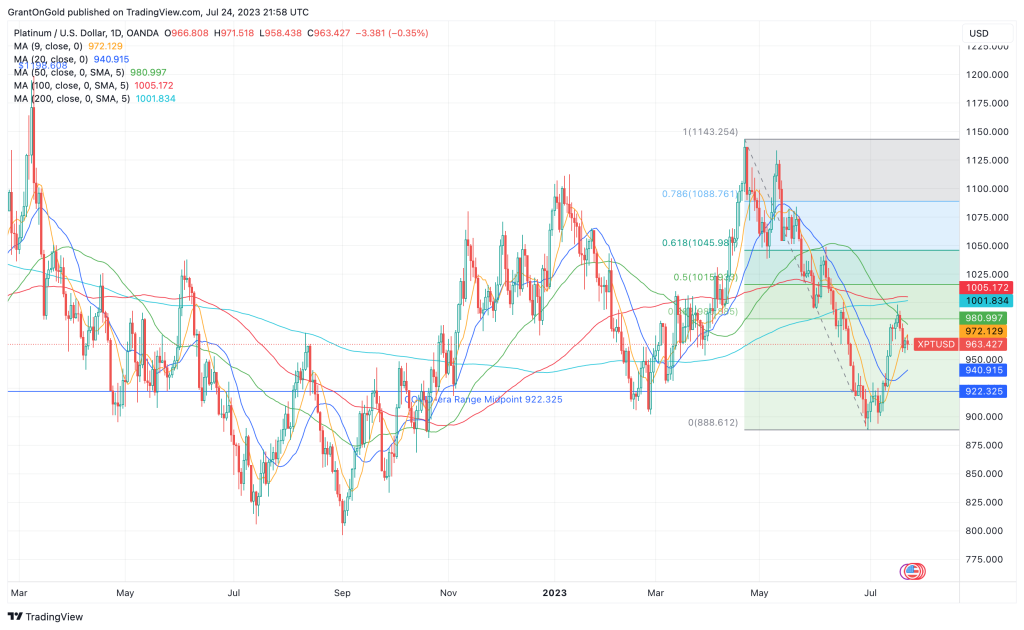
Consolidative range trading persists. A rebound above $1000 would set a more favorable tone within the $564.70/$1339.35 range.
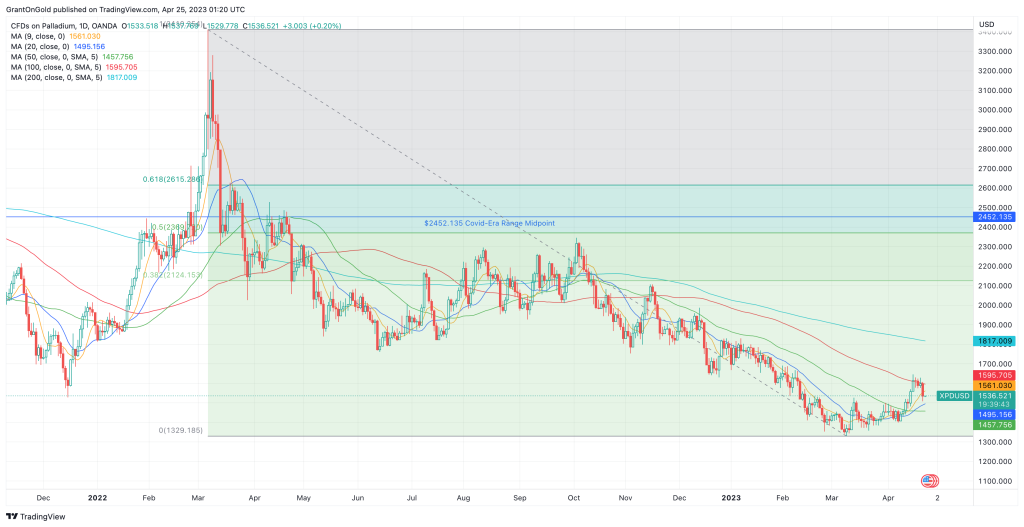
Palladium remains defensive near 4½-year lows.
Non-Reliance and Risk Disclosure: The opinions expressed here are for general information purposes only and should not be construed as trade recommendations, nor a solicitation of an offer to buy or sell any precious metals product. The material presented is based on information that we consider reliable, but we do not represent that it is accurate, complete, and/or up-to-date, and it should not be relied on as such. Opinions expressed are current as of the time of posting and only represent the views of the author and not those of Zaner Metals LLC unless otherwise expressly noted.
.png)