Grant on Gold – April 24, 2023
Monday, April 24, 2023Gold slid more than 1% last week, logging a second consecutive lower weekly close. The yellow metal is being weighed by heightened expectations for another Fed rate hike in May, while geopolitical and growth risks are limiting the downside thus far.
Focus is already on next week’s FOMC meeting, where another 25-bps rate hike is widely expected. The CME’s FedWatch tool places the probability at 92%. The odds for an additional 25-bps hike in June continue to edge higher and now stand at 24.1%.
The Fed seems to think they have more to do on the inflation front, even as the market’s expectations for inflation continue to moderate. The index of common inflation expectations fell to 2.22% in Q1, the lowest level since Q2-21.
Meanwhile, incoming data continue to suggest the economy is slowing. The minutes from the March FOMC meeting revealed that even the central bank’s staff believe a mild recession will begin “later this year, with a recovery over the subsequent two years.”
In addition, job growth slowed in March and is forecast to come in weaker yet in April. Median expectations for nonfarm payrolls are +175k, down from +236kn in March.
A recession would certainly knock inflation lower, as would slower jobs and wage growth. However, the market seems to believe the Fed won’t wait for any of that to happen and will instead remain aggressive in battling price risks. That strategy does not bode well for a soft landing.
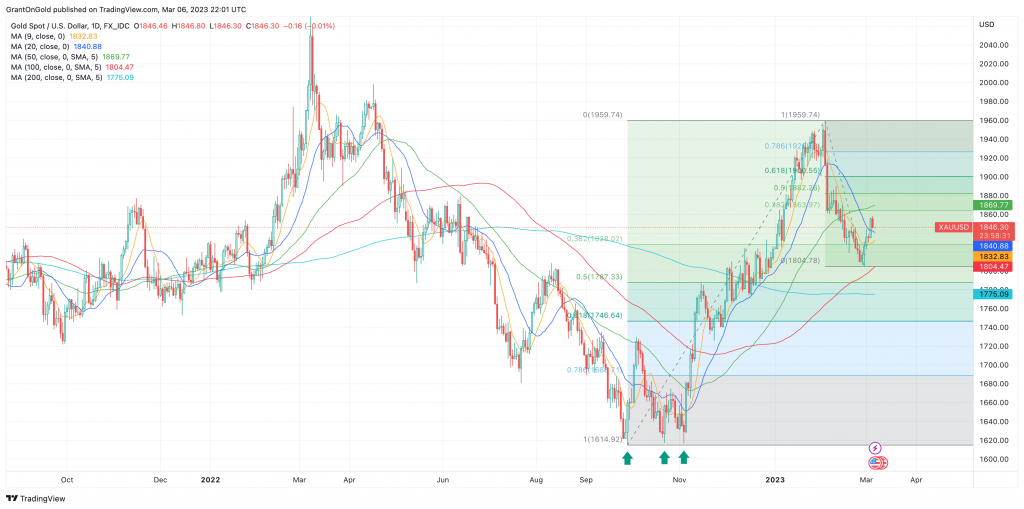
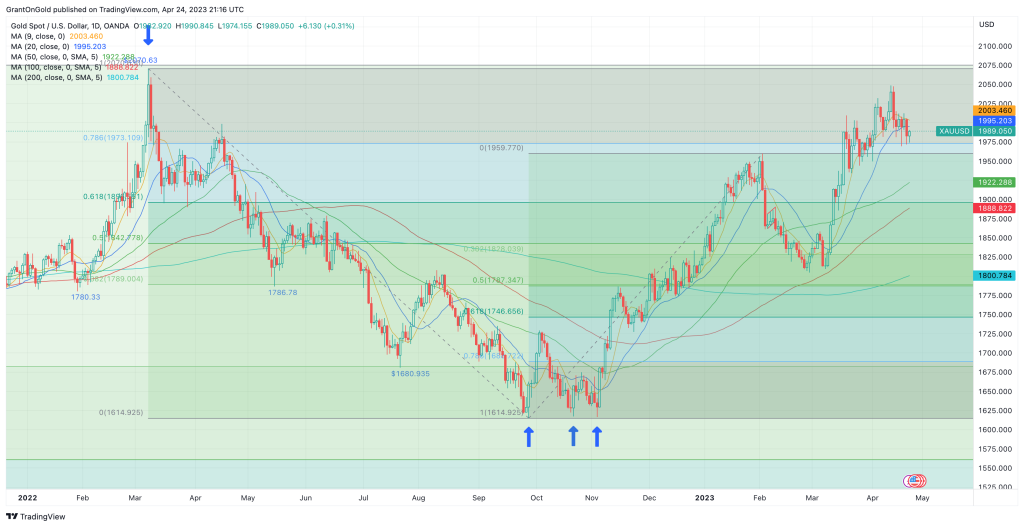
With gold trading less than 4% off its all-time high of $2075.28, the yellow metal is arguably well positioned to push to record highs if the Fed (and other central banks) are put in the position of having to reverse course and start easing policy. My first significant technical objective would be $2194.58 based on a Fibonacci projection.
Last week I suggested short-term downside potential was to $1959. So far, the market has traded as low as $1969.30. There is scope for further tests of the downside until the next policy announcement on May 3rd, particularly if prospects for a June rate hike continue to increase.
Silver
Silver ended last week with a 1.1% loss, but a firmer tone prevailed on Monday. Thus far, the white metal is holding its 20-day moving average.
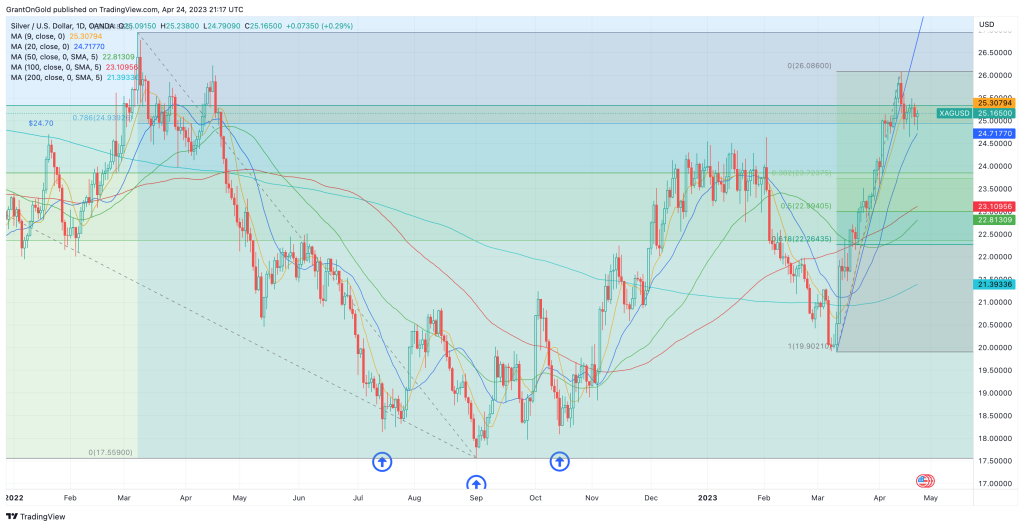
While the trend remains favorable, rising economic growth risks warrant a measure of caution. Silver ETFs saw significant outflows last week, suggesting that investors may lack confidence in the fundamentals needed to push silver back to the critical $30 zone.
A recession later in the year could result in a significant retracement of the March-April rally, but I also suspect the Fed will be quick to start cutting rates in reaction. That would help limit downside potential as will the more favorable economic prospects for China as the world’s second-largest economy continues to recover from COVID lockdowns.
Last week, the Silver Institute highlighted that “all major demand categories achieved record highs in 2022.” Total silver demand jumped 18% y/y to a record 1.242 billion ounces.
Amid this strong demand environment and a marginal contraction in mine output, the supply deficit reached 237.7 Moz in 2022. The Silver Institute called it "possibly the most significant deficit on record."
The Silver Institute is projecting that the silver market will remain out of balance in 2023, to the tune of 142.1 Moz. If confirmed, it would be the third consecutive annual supply deficit, which should help underpin the market.
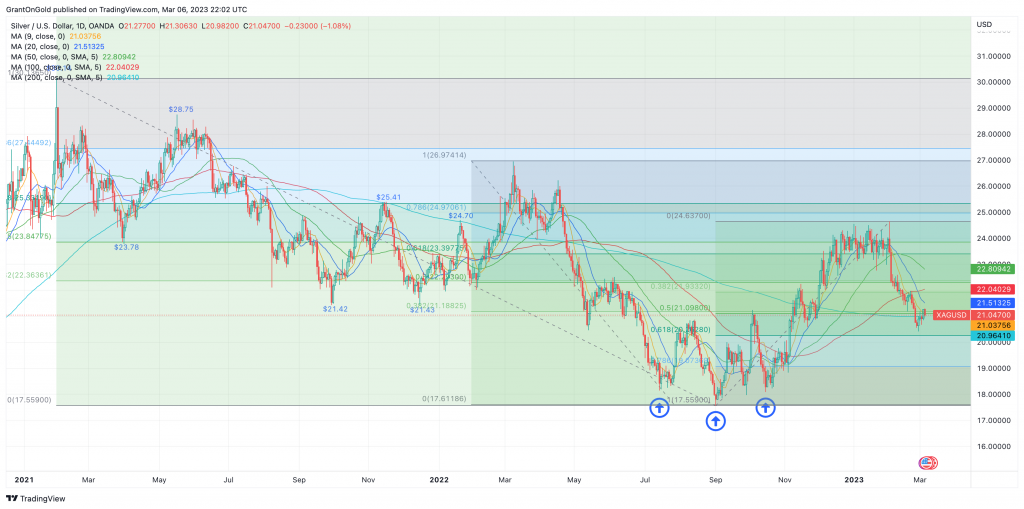
Renewed probes about $26 would return focus to the $26.95 high from March 8, 2022. The latter is seen as the trigger that would put the key COVID-era highs at $29.86/$30.14 in play.
On the downside, a violation of the 20-day SMA at $24.83 would shift attention to congestive support around $23.70, which corresponds with the 38.2% retracement level of the rally from $19.90. Short-term losses are still seen as corrective in nature.
PGMs
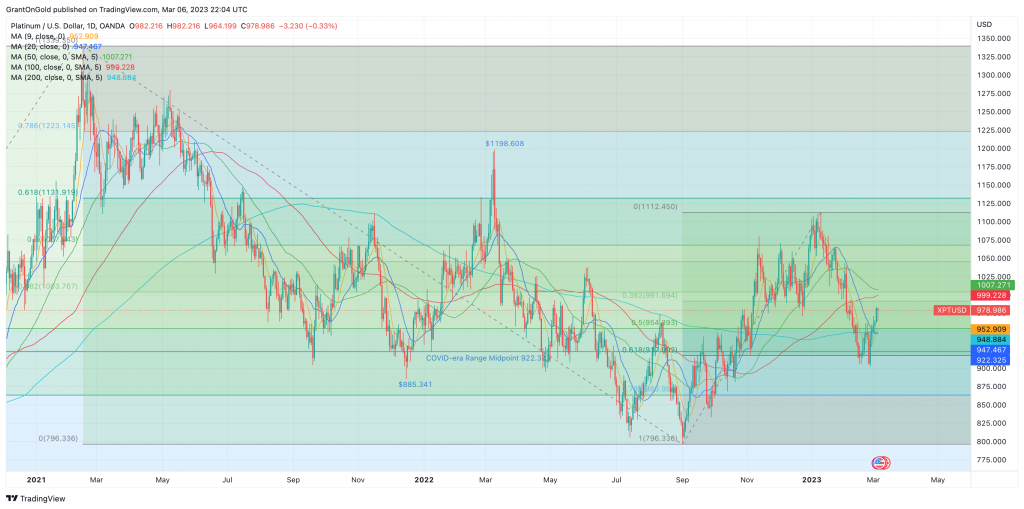
Platinum surged nearly 8% last week, establishing a 13-month high at $1143.25. It was the sixth consecutive higher weekly close.
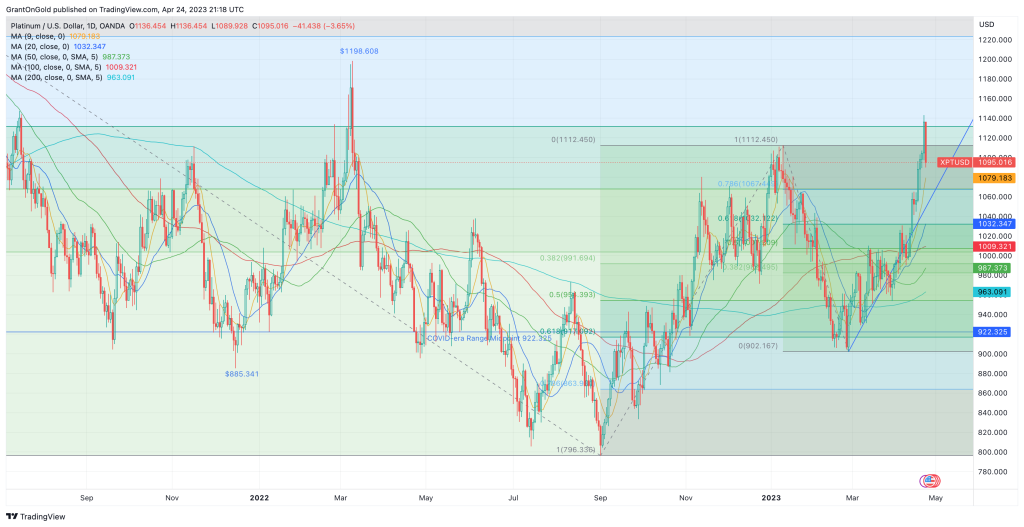
However, platinum had become quite overextended, the most since December 2020. Corrective pressures emerged on Monday, resulting in a loss of 3.6%.
At this point, I’m viewing this week’s setback as corrective. While mounting growth risks do have the potential to take the wind out of platinum’s sails, supply and demand fundamentals are likely to limit the downside.
Persistent power issues in South Africa should keep supply tight. The deficit is expected to reach 556 koz this year.
On the demand side of the equation, global light vehicle sales are expected to increase by 6.2% in 2023 to 86.1 million units. The China Association of Automobile Manufacturers (CAAM) is projecting a 3% bump in Chinese sales to 27.6 million units. That would be nearly a third of projected global sales.
CAAM is anticipating that demand for “new-energy” vehicles will increase by 35% to 9 million units. That will do more for silver and copper than platinum.
While auto sector supply chain issues are still likely to be a problem, ongoing platinum for palladium substitution and increased loading in catalytic converters should help to underpin platinum.
Despite 6-weeks of gains in palladium, the chart suggests the gains were corrective in nature. Recent probes above the 100-day SMA could not be sustained and palladium retreated more than 4% on Monday.
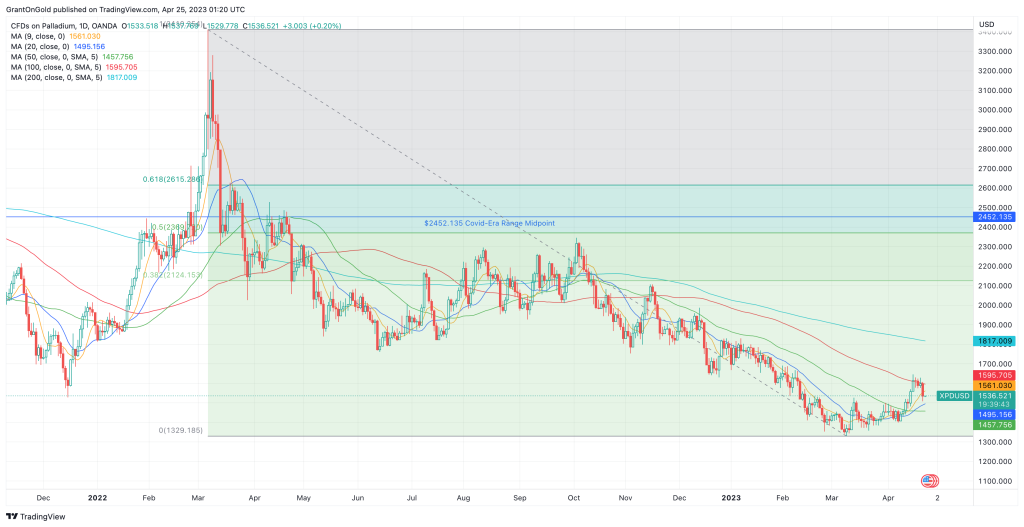
A retreat below $1489/87 would return a measure of credence to the dominant downtrend, returning focus to the $1329.18 low from March 9th.
Non-Reliance and Risk Disclosure: The opinions expressed here are for general information purposes only and should not be construed as trade recommendations, nor a solicitation of an offer to buy or sell any precious metals product. The material presented is based on information that we consider reliable, but we do not represent that it is accurate, complete, and/or up-to-date, and it should not be relied on as such. Opinions expressed are current as of the time of posting and only represent the views of the author and not those of Zaner Metals LLC unless otherwise expressly noted.