Grant on Gold – August 14, 2023
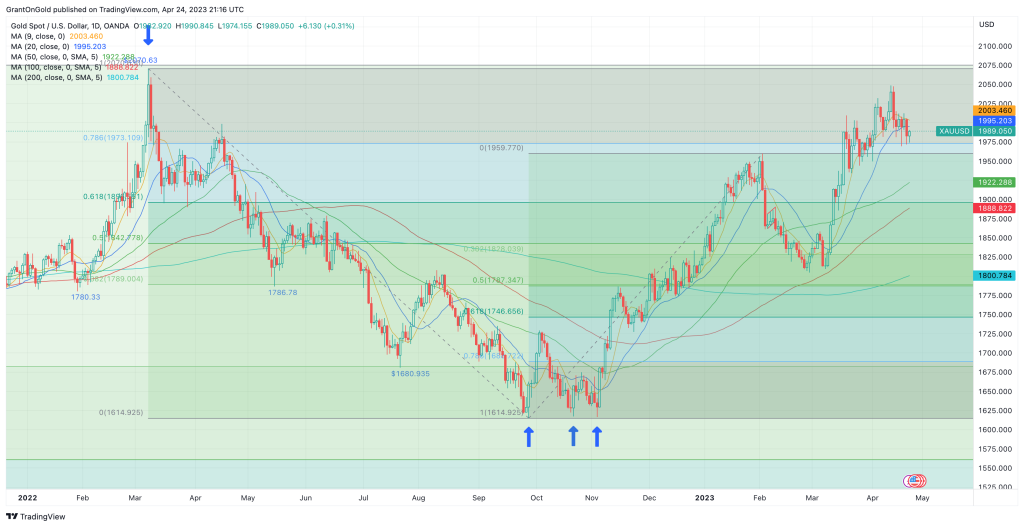
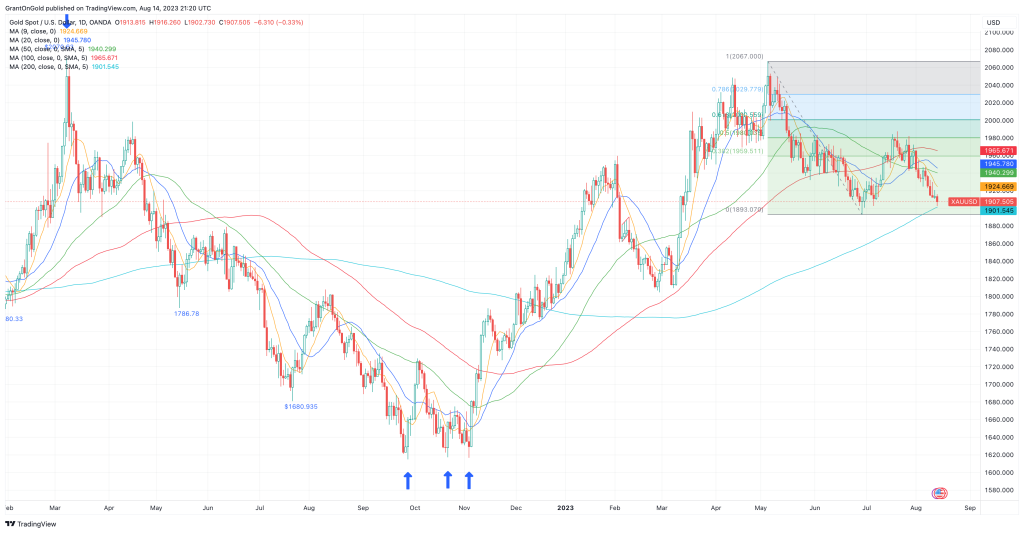
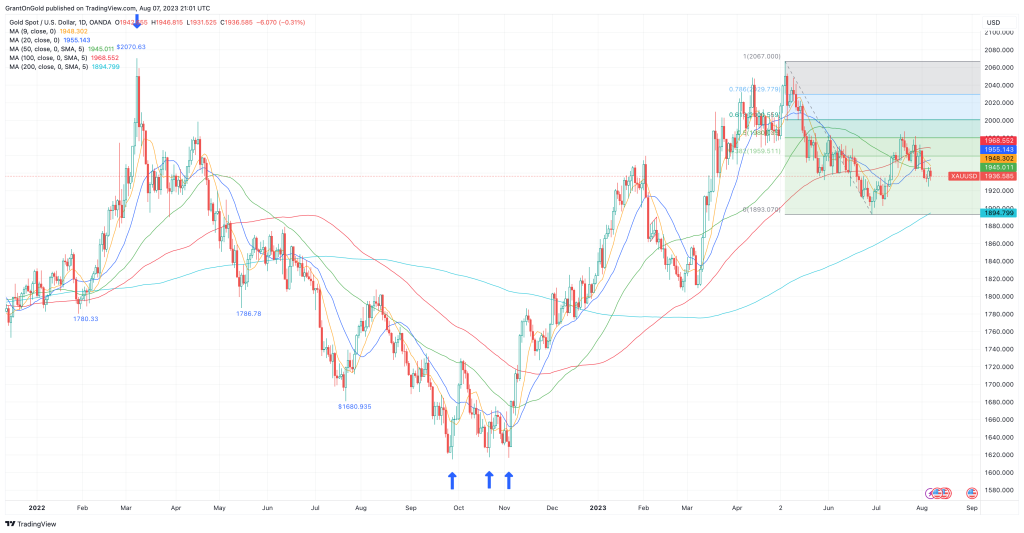
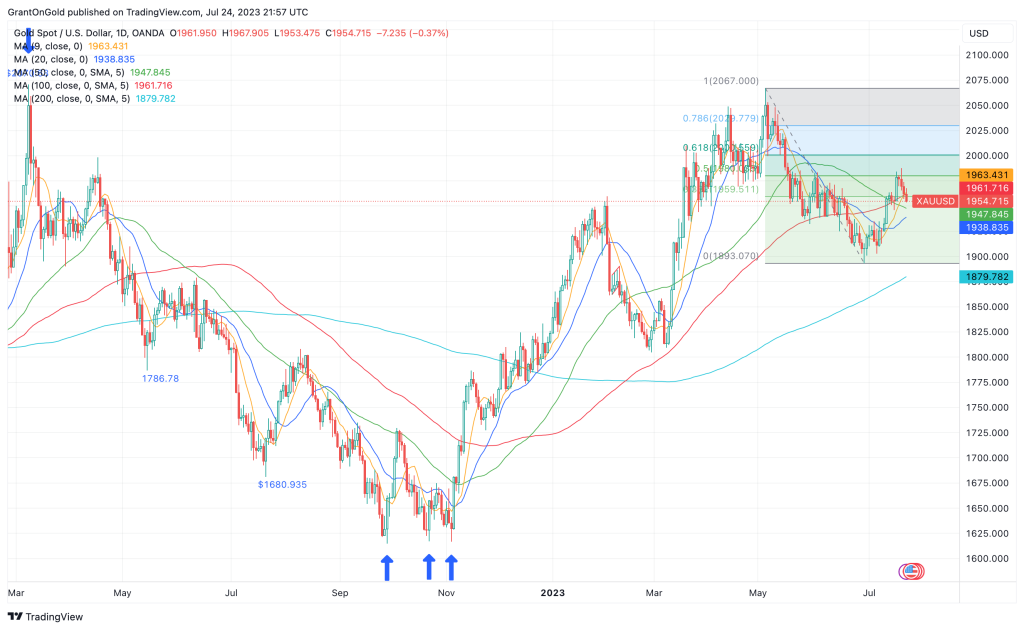
Monday, August 14, 2023Gold remains on the defensive after seeing a third consecutive lower weekly close last week and extending to a 6-week low on Monday of $1902.73. Concerns about the Chinese economy and some uncertainty as to whether the Fed’s tightening cycle is over have conspired to weigh on a broad range of commodities.
Last week’s U.S. inflation data suggests that the recent cooling trend in prices has at a minimum slowed, and possibly reversed. July CPI ticked up to 3.2% y/y, versus 3.0% in June. PPI rose to 0.8% y/y in July, versus 0.2% in June.
Lingering inflation along with the July nonfarm payrolls miss sparked a modest uptick in expectations for a rate hike before year-end. However, the market is still fairly convinced that the Fed will hold steady at its next meeting in September.
The heightened prospects for tighter monetary policy pushed the 10-year yield back within striking distance of the October high at 4.337%. The dollar index followed yields higher to set a 5-week high on Monday, adding additional weight to the yellow metal.
Interest rates have already risen dramatically since the Fed’s tightening cycle began back in March of 2022. The Fed funds rate has gone from 0% to 5.25-5.5%. That’s a significant rise in the cost of carrying debt at a time when the country’s and individual debt loads are on the rise.
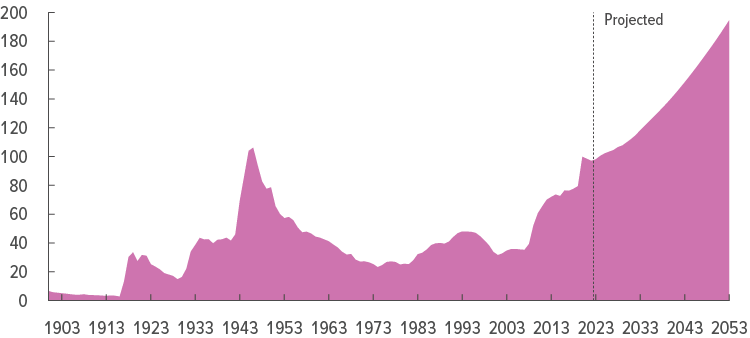
The national debt stood at $31.5 trillion as of Q1-2023. Estimates now put the debt load closer to $32.7 trillion. If that number is accurate, nearly $10 trillion has been added to the national debt in just the last several years alone since the beginning of the COVID crisis. That’s a surge of more than 40%!
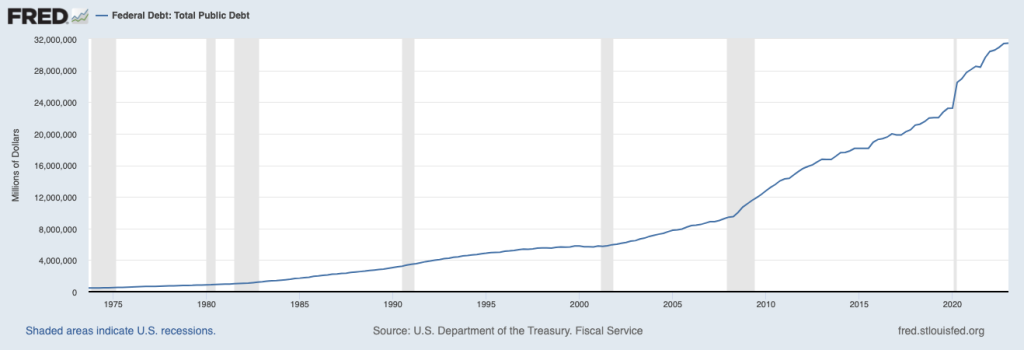
Each citizen’s share of that debt is around $97,550. If you divide it among taxpayers that share jumps to $253,686.
Meanwhile, the credit card debt of American citizens surpassed an inauspicious milestone in Q2, exceeding $1 trillion for the first time ever. Overall household debt rose to $17.06 trillion.
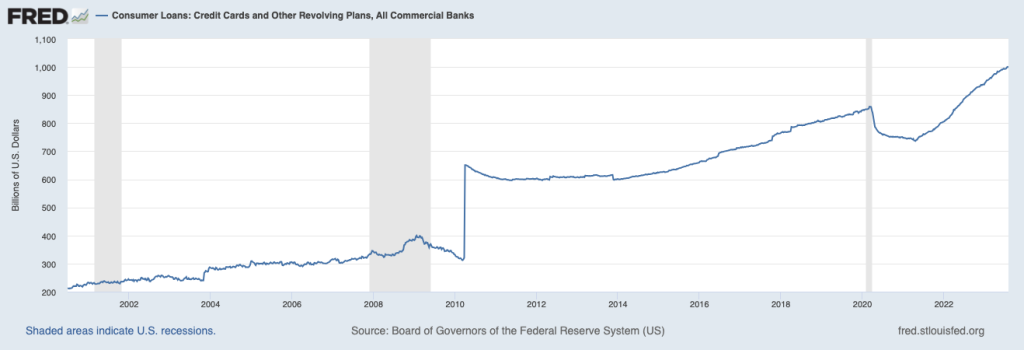
That’s a monumental debt load no matter how you slice it. Rising interest rates will only make it more difficult for America and Americans to extract themselves from this burdensome situation, especially with student loan payments slated to resume for many in October.
While the Fed has stated its goal is to bring inflation back to the 2% level, there may come a point when a higher rate of inflation becomes desirable to help inflate away the debt. In that situation, the ones that really pay are savers that are capturing a yield lower than the rate of inflation.
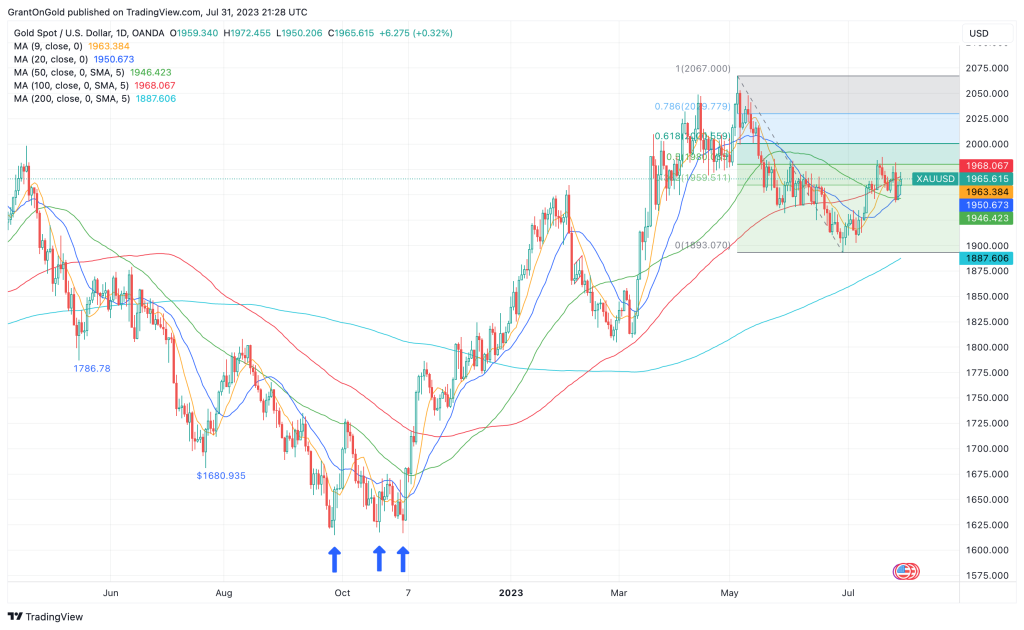
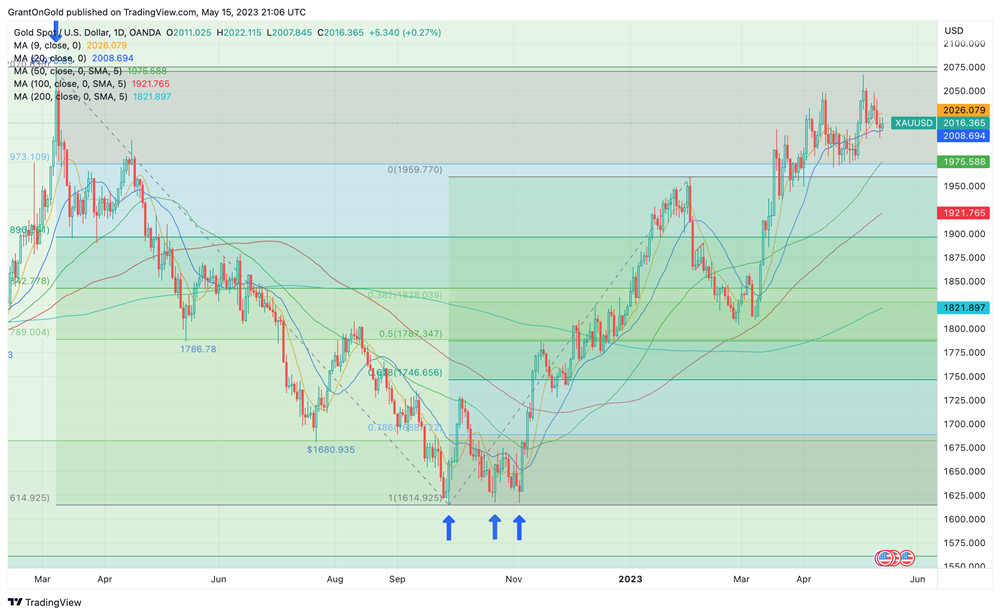
One of the best ways to preserve one’s wealth in an inflationary environment is to buy physical gold. In 2021 inflation began to surge due to government spending (see the national debt graph above) and pandemic-related supply chain disruptions.
CPI jumped from 1.7% in February of 2021 to 2.6% in March. At the time gold was trading around $1734. By the time CPI topped out at 9.1% in July of 2022 gold had challenged its record high above $2070. Only drastic action by the Fed prevented new record highs.
During the previous major inflationary period during the 1970s, gold rose from around $35 at the start of the decade to $512 in December of 1979. In January 1980 the yellow metal reached the unheard-of level of $850, a 10-year rise of 2,329%.
Here too only drastic action by legendary Fed chairman Paul Volcker finally tamped inflation and gold. It took a Fed funds rate of 20%.
Setbacks offer buying opportunities for wealth-preservation-minded investors.
Silver
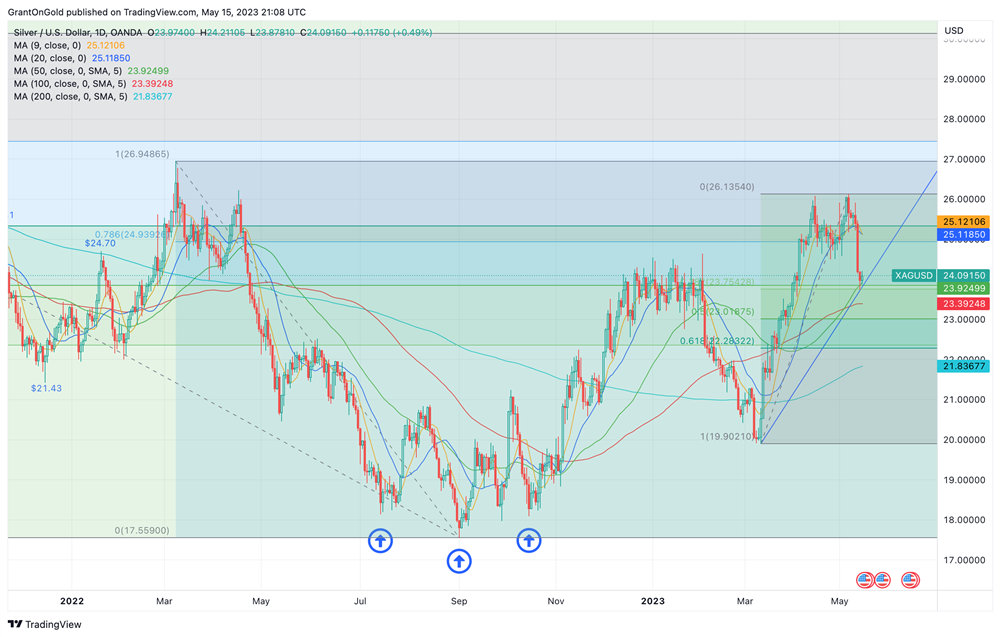
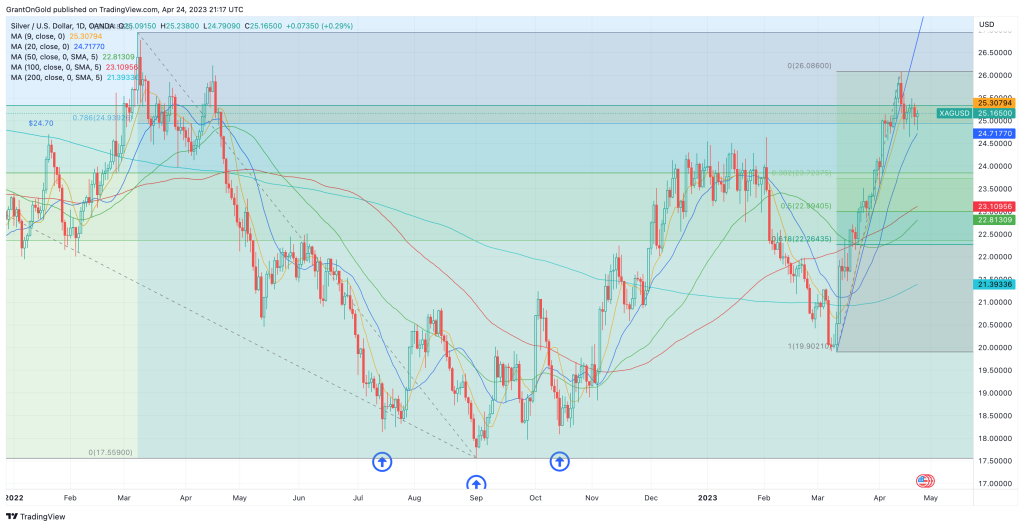
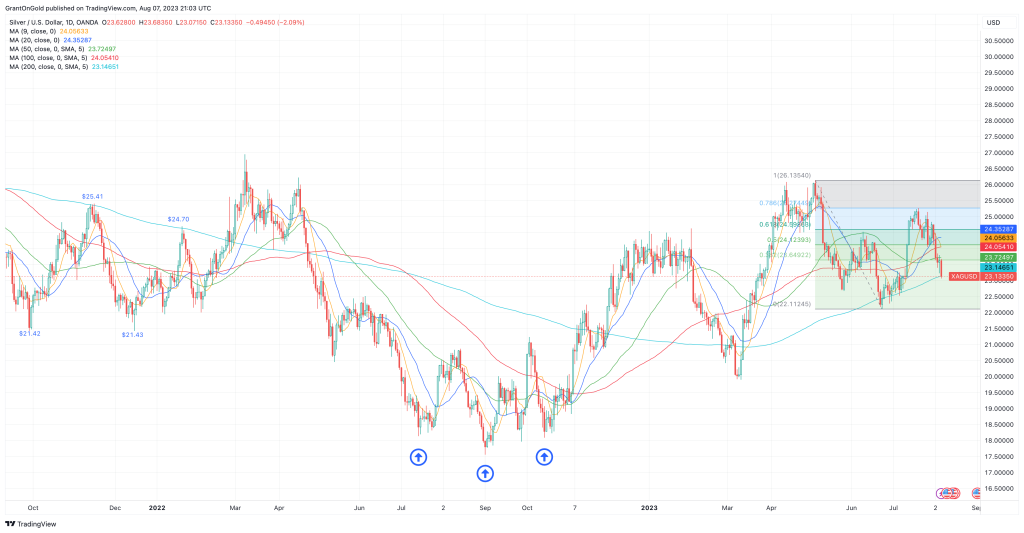
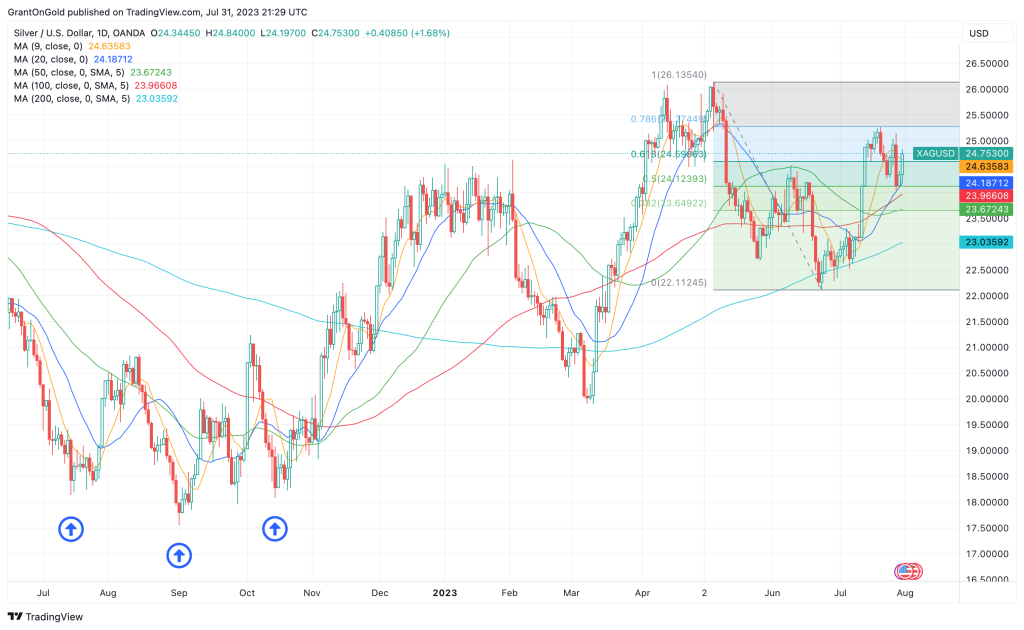
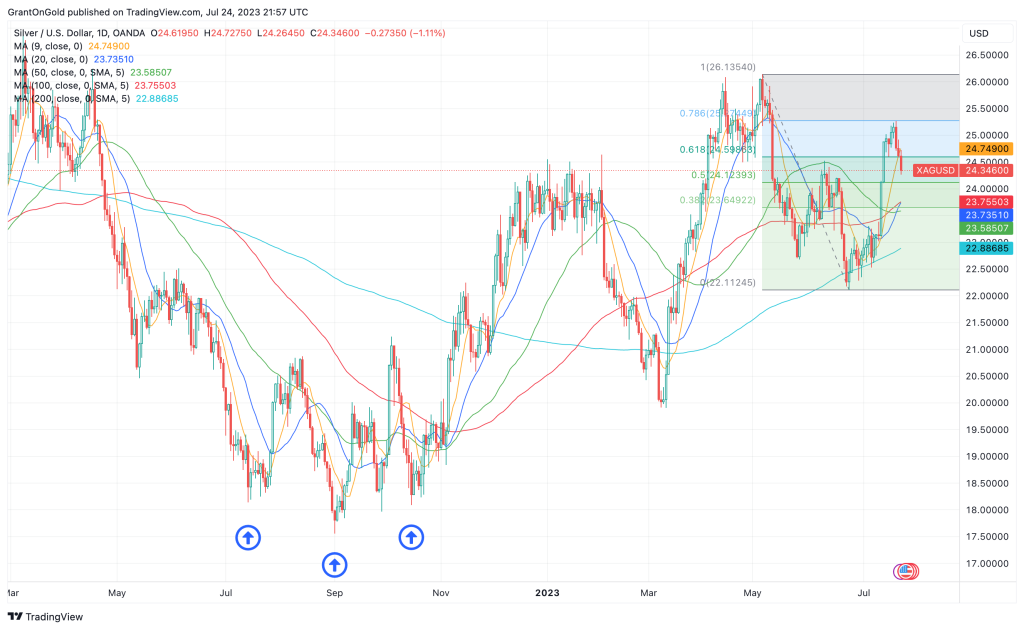
Silver tumbled nearly 4% last week, notching a fourth consecutive lower weekly close. Follow-through losses on Monday saw a 6-week low set at $22.37.
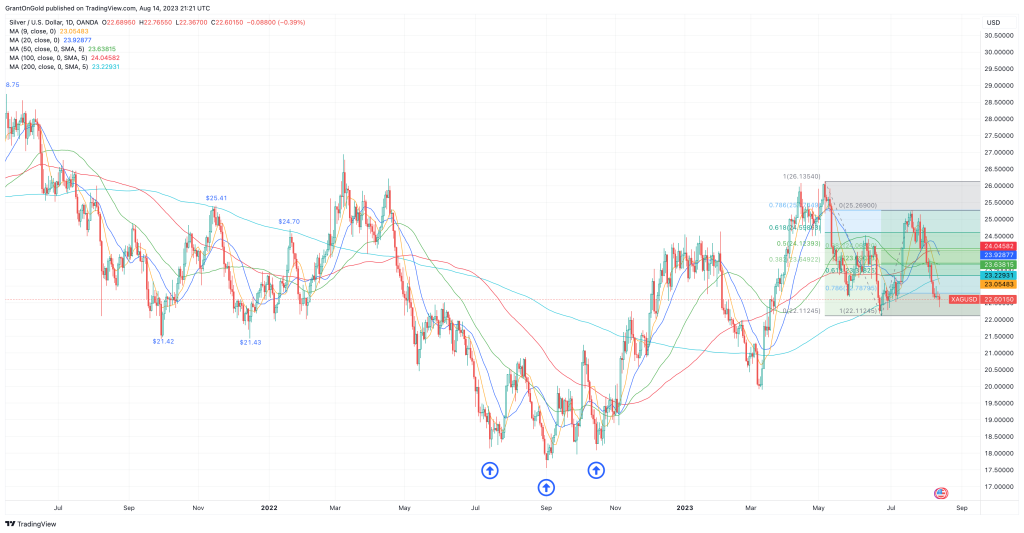
The white metal violated the 50-week, 100-week, and 200-week moving averages on Monday. While the latter was only penetrated slightly and silver firmed into the close, the downside remains vulnerable.
A true challenge of the June low at $22.11 seems likely. If this level gives way, potential would be to the $21.25 Fibonacci level.
Metals like silver that derive the majority of their demand from industry need strong growth from major economies to support prices. Lately, data from China, the world’s second-largest economy, have been rather bleak and the government seems to be reluctant to offer full-fledged stimulus.
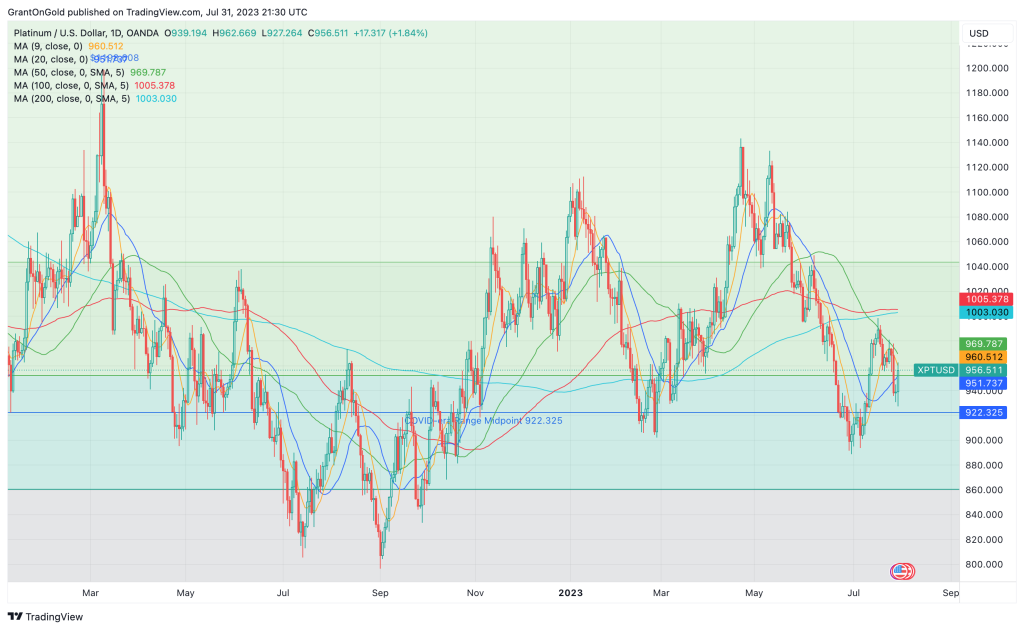
PGMs
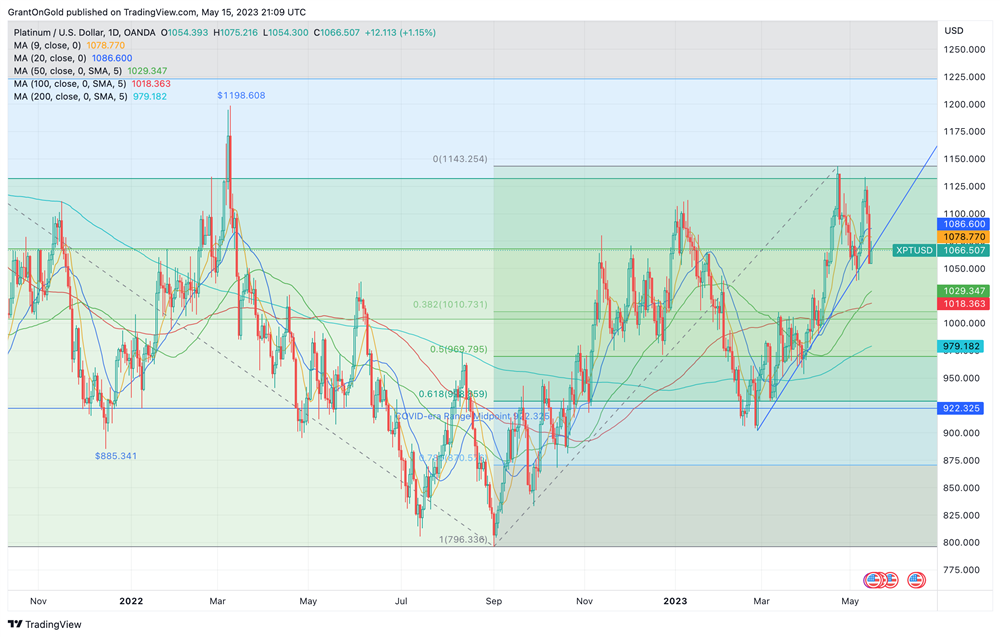
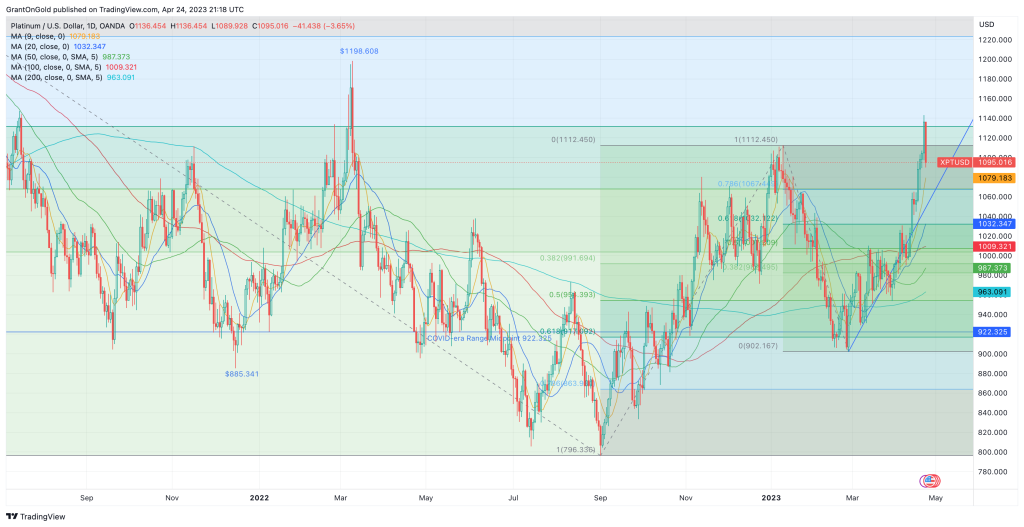
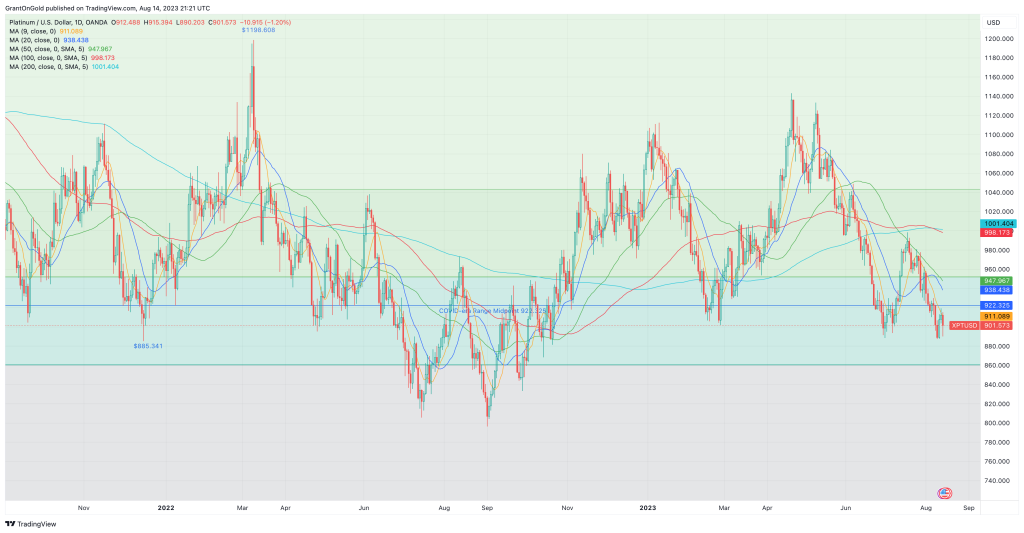
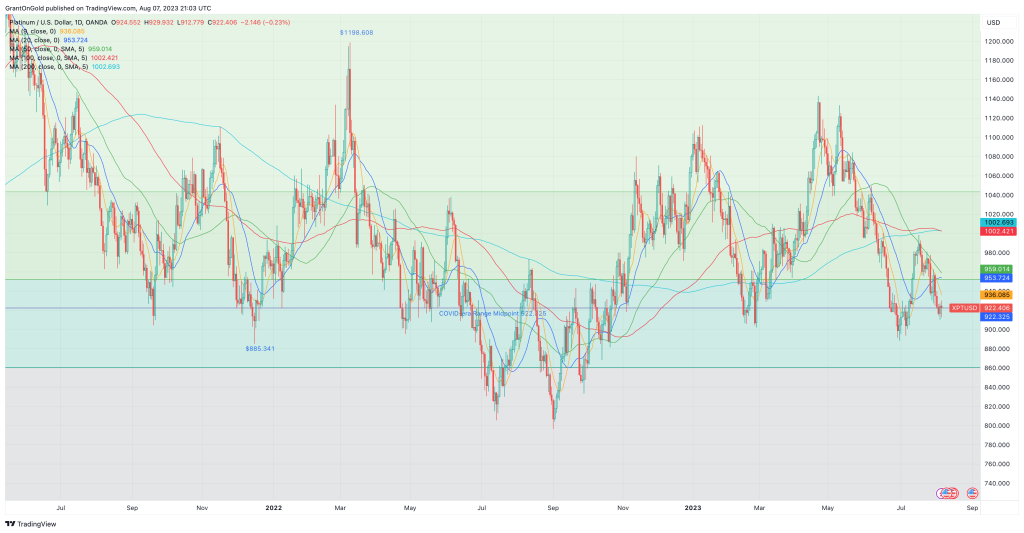
The PGMs are also being weighed by China’s economic woes.
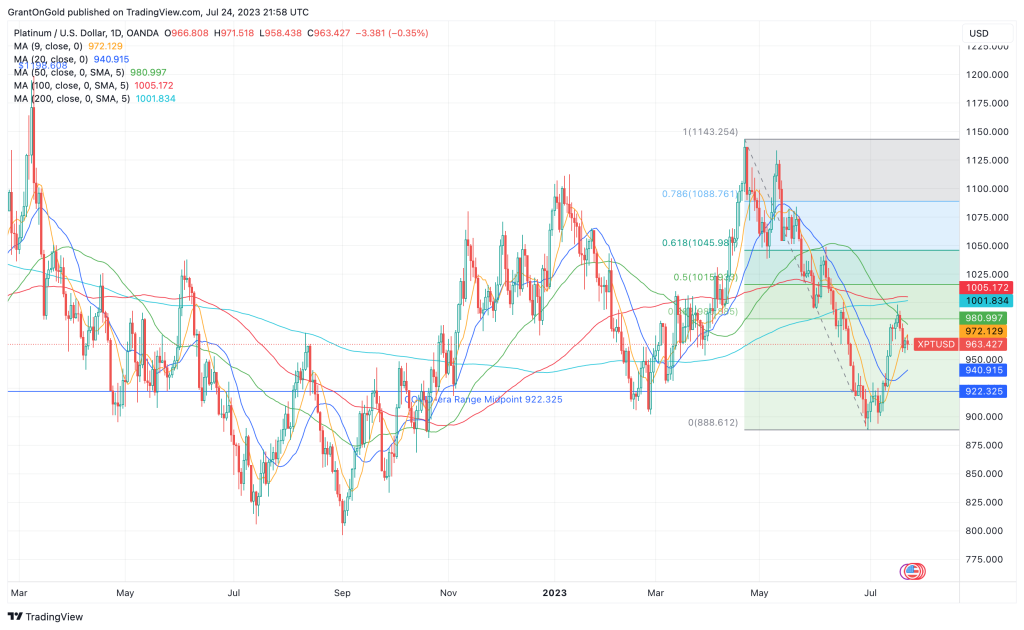
Platinum notched a fourth consecutive lower weekly close last week, reaching a 9-month low at $887.39. The market remains defensive to start the new week.
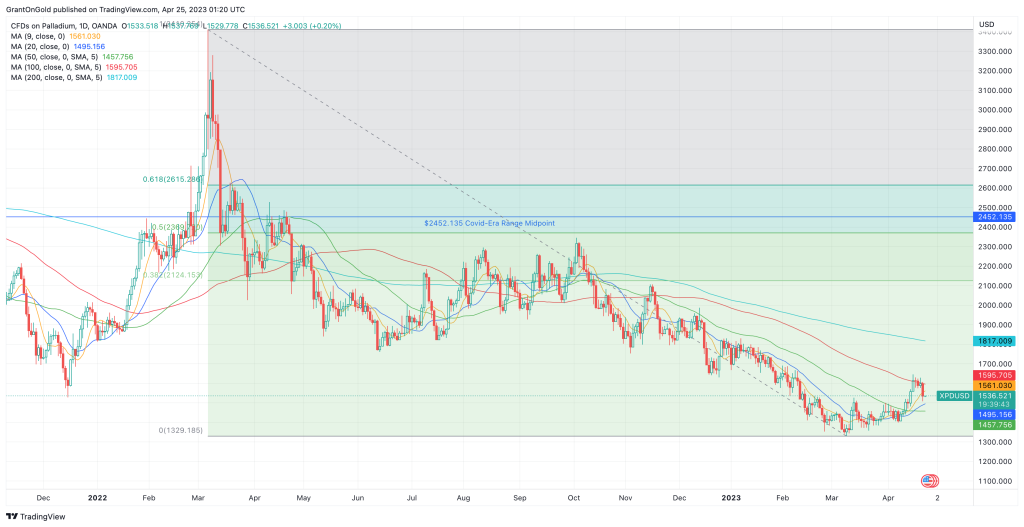
Palladium continues to consolidate just above multi-year lows. The downside may be at least temporarily limited by the record net short positioning in the market, but it’s going to be difficult to scare up any buyers given the Chinese growth risks and deflationary pressures.
Non-Reliance and Risk Disclosure: The opinions expressed here are for general information purposes only and should not be construed as trade recommendations, nor a solicitation of an offer to buy or sell any precious metals product. The material presented is based on information that we consider reliable, but we do not represent that it is accurate, complete, and/or up-to-date, and it should not be relied on as such. Opinions expressed are current as of the time of posting and only represent the views of the author and not those of Zaner Metals LLC unless otherwise expressly noted.
.png)