Morning Metals Call
Monday, October 21, 2024Good morning. The precious metals are mostly higher in early U.S. trading.
U.S. calendar features Leading Indicators.
FedSpeak due from Logan, Kashkari, & Schmid.
10/18/2024
Gold pushes to record highs above $2,700 while silver surges to new 12-year highs
OUTSIDE MARKET DEVELOPMENTS: Hamas leader Yahya Sinwar, the architect of the October 7th atrocities, was killed by an Israeli drone on Thursday. "This is a good day for Israel, for the United States, and for the world,” said President Joe Biden.
Biden believes that Sinwar's death may have opened a "path to peace — a better future in Gaza without Hamas.” He urged that stalled cease-fire talks be reinvigorated and a hostage release deal be reached.
However, Sinwar's deputy Khalil al-Hayya said Hamas’s conditions for a cease-fire and hostage deal remain unchanged. “Today, evil has suffered a heavy blow, but the task before us is not yet complete,” said Israeli Prime Minister Netanyahu.
It is Netanyahu's position that the war "is not over yet.” Arguably the elimination of Hamas leadership creates uncertainty. It is possible that the next leader of Hamas could be more extreme than Sinwar.
China's GDP slowed to 4.6% in Q3, above expectations of 4.5%, versus 4.7% in Q2. It's the weakest quarterly print in more than a year. Persistent housing market woes, weak consumer demand, and slower exports are all weighing on growth.
The PBoC immediately announced a C¥800 bln ($112.38 bln) stock buyback and equity swap scheme to bolster markets. China's benchmark CSI300 index rebounded from early losses to end the session 3.6% higher.
The central banks also pledged to "strengthen inter-department coordination, create synergies and make full use of the policies to reinvigorate market confidence, improve people's expectations and promote sustained economic recovery."
While Beijing appears committed to attaining its 5% growth target, jawboning and dribbling out stimulus measures has disappointed the trade in recent weeks. We'll see if there's upside follow-through in Chinese shares next week, or if markets continue to press Beijing to fire a policy howitzer to bolster the bazooka-sized measures announced in September.
U.S. housing starts slowed by 0.5% to 1.354M pace in September, above expectations of 1.349M, versus an upward revised 1.361M in August. Single-family starts rose 2.7% to 1.027M, the strongest in five months, but multi-family starts fell 9.4% to a four-month low of 0.361M. The recent rebound in mortgage rates suggests a persistent headwind for housing into year-end.
We'll get the September Treasury Budget later today. The market is expecting to see a $16 bln surplus.
FedSpeak is due from Bostic, Kashkari, and Waller.
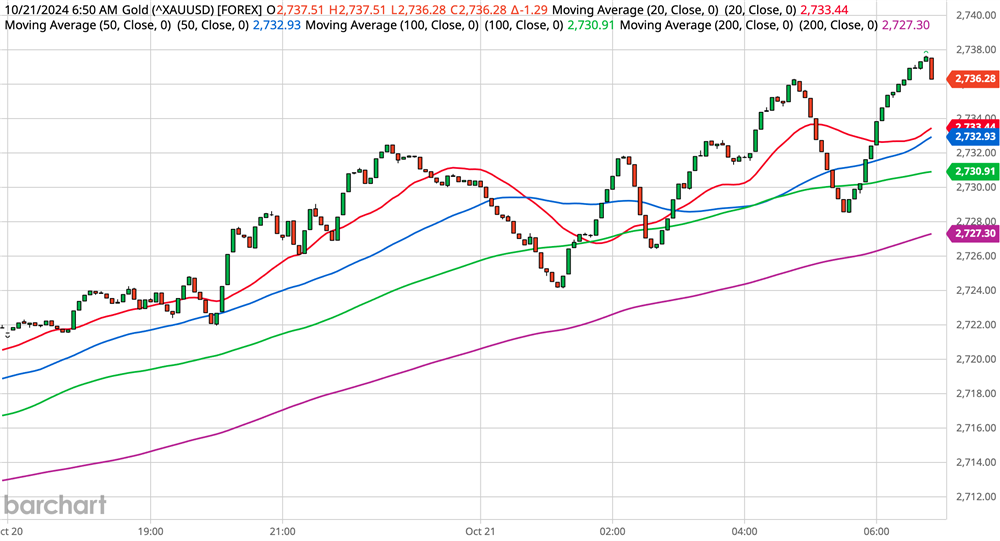
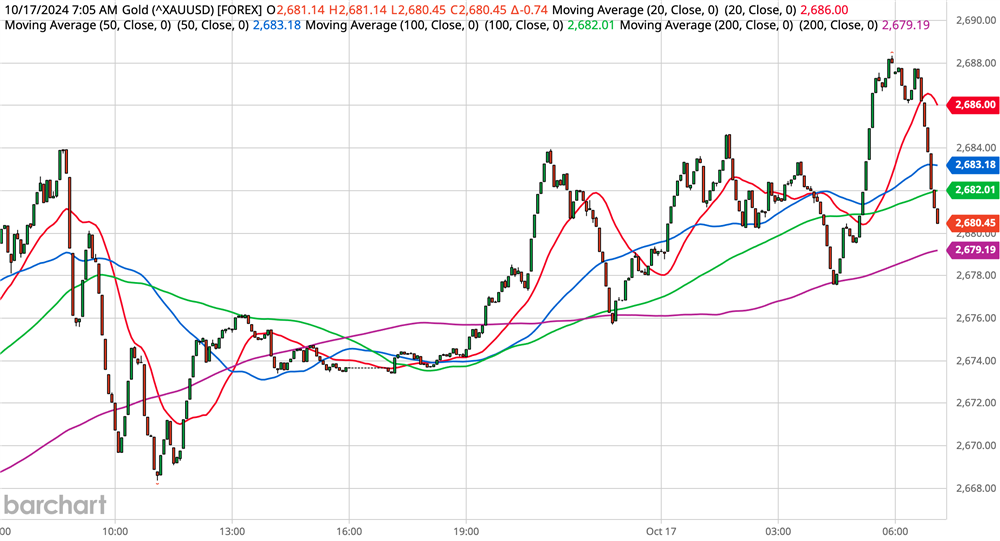
GOLD
OVERNIGHT CHANGE THROUGH 6:00 AM CDT: +$19.77 (+0.73%)
5-Day Change: +$57.87 (+2.18%)
YTD Range: $1,986.16 - $2,719.06
52-Week Range: $1,812.39 - $2,719.06
Weighted Alpha: +39.91
Gold jumped to new record highs above $2,700 buoyed by persistent geopolitical tensions and expectations of further central bank easing. The yellow metal is poised for a second consecutive higher weekly close. 
With less than three weeks until the U.S. elections most presidential polls remain within the margin of error. Similarly, which parties will secure House and Senate majorities appear to be toss-ups. The resulting uncertainty, and perhaps some fears of unrest, are contributing to safe-haven demand for gold.
Analysts at UBS believe the rally could continue for another six to twelve months, driven by central bank easing and ongoing "strong" official sector buying of gold. UBS sees potential for the yellow metal to reach $2,900 by September 2025.
I continue to believe gold could reach $3,000 in Q1'25. My measuring objective at $2,718.42 has been satisfied and exceeded, shifting focus to a Fibonacci projection at $2,732.55. The next Fibonacci level beyond that comes in at $2,810.38.
We could see some profit-taking ahead of today's close, but corrective setbacks should continue to attract buying interest. Initial support is noted at $2,702.75/$2,700.00, which protects the more important $2,692.49/$2,684.45 zone and $2,673.68 level.
SILVER
OVERNIGHT CHANGE THROUGH 6:00 AM CDT: +0.464 (+1.46%)
5-Day Change: +$1.239 (+3.93%)
YTD Range: $21.945 - $32.910
52-Week Range: $20.704 - $32.910
Weighted Alpha: +43.76
Silver is on the bid after pushing to new 12-year highs above $32.700 helped by gold market strength and the latest PBoC accommodations. Stops were likely triggered above $32.700 contributing to more than 20¢ of follow-through buying. 
Today's upside breakout lends considerable credence to the bullish scenario that calls for a challenge of the $35.217 Fibonacci level (61.8% retracement of the decline from $49.752 to $11.703). An eventual breach of this level would bode well for a return to the record high around $50.
Former resistance at $32.700 now marks initial support. Secondary support is $32.0904/$32.000.
Peter A. Grant
Vice President, Senior Metals Strategist
Zaner Metals LLC
Tornado Precious Metals Solutions by Zaner
312-549-9986 Direct/Text
[email protected]
www.ZanerPreciousMetals.com
www.TornadoBullion.com
X: @GrantOnGold
X: @ZanerMetals
Facebook: @ZanerPreciousMetals
Non-Reliance and Risk Disclosure: The opinions expressed here are for general information purposes only and should not be construed as trade recommendations, nor a solicitation of an offer to buy or sell any precious metals product. The material presented is based on information that we consider reliable, but we do not represent that it is accurate, complete, and/or up-to-date, and it should not be relied on as such. Opinions expressed are current as of the time of posting and only represent the views of the author and not those of Zaner Metals LLC unless otherwise expressly noted.
10/17/2024
Gold sets new record highs while silver consolidates below $32
OUTSIDE MARKET DEVELOPMENTS: As widely expected, the ECB cut its deposit facility rate by 25 bps. The vote was unanimous. This was the first back-to-back cut since the easing cycle began in June.
The ECB may now be comfortable accelerating the pace of rate cuts to achieve a truly accommodative policy stance. "No question that we are currently restrictive," said ECB President Christine Lagarde.
While the policy statement contends the "disinflationary process is well on track," the ECB is not pre-committing to a particular rate path. The central bank reiterated that it will "continue to follow a data-dependent and meeting-by-meeting approach to determining appropriate level and duration of restriction."
The Bank of Canada is expected to cut rates next week. The Fed and the Bank of England are expected to ease when they announce policy on 07-Nov.
Iran has warned Israel not to retaliate for the massive missile barrage that hit the country on 01-Oct. " If you do, and target us in any way, whether in the region or in Iran, we will strike you in a painful manner again," said the commander of Iran's Revolutionary Guards.
Meanwhile, Russia's Deputy Foreign Minister warned Israel against striking Iran's nuclear facilities. He said such an attack would be a "catastrophic development."
China pledged to nearly double the funds available for loans to complete existing real estate projects to C¥4 trillion. Once again, Chinese markets were not impressed.
China's property crisis began several years ago when Beijing cracked down on the sector's high levels of debt. Adding debt that also adds inventory to the market, without addressing weak homebuyer confidence doesn't seem like a well-thought-out plan.
U.S. retail sales rose 0.4% in September, above expectations of +0.3%, versus +0.1% in August. Ex-auto rose 0.5% on expectations of +0.2%, versus a positive revised +0.2% in August (was +0.1%). A resilient consumer provides support to the broader economy.
U.S. Philly Fed Index rose 8.6 points to 10.3 in October, above expectations of 3.0, versus 1.7 in September. More than 24% of participants reported increases in general activity. Nearly 35% of firms reported increases in input prices, 5% reported decreases, and 60% reported no change.
Philly Fed Manufacturing Business Outlook Survey

U.S. NAHB Housing Market Index rose 2 points to 43 in October, versus an eight-month low of 39 in August. The recent rebound in mortgage rates intensified the headwind faced by the housing market.
U.S. industrial production fell 0.3% in September, below expectations of -0.1%, versus a negative revised +0.3% in August (was +0.8%). Cap use slipped to 77.5%.
U.S. initial jobless claims fell 19k to 241k in the week ended 12-Oct, inside expectations of 245k, versus 260k in the previous week.
U.S. business inventories rose 0.3% in August in line with expectations, versus a negative revised +0.3% in July.
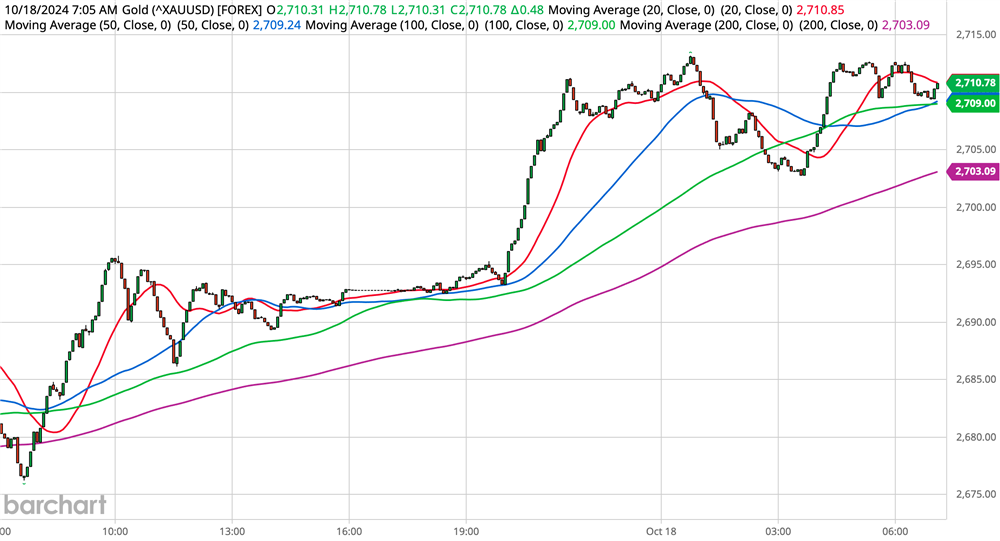
GOLD
OVERNIGHT CHANGE THROUGH 6:00 AM CDT: +13.81 (+0.52%)
5-Day Change: +$63.22 (+2.40%)
YTD Range: $1,986.16 - $2,695.77
52-Week Range: $1,812.39 - $2,695.77
Weighted Alpha: +38.37
Gold has set new record highs against the dollar, following the path blazed by the yellow metal against other currencies yesterday. Geopolitical tensions, political uncertainty, dedollarization, and the latest central bank rate cut are all seen as supportive.
Today's ECB rate cut is seen as just the latest evidence that most central banks are on a protracted easing path. Additional cuts are expected from the BoC, BoE, and the Fed in the weeks ahead. Lower interest rates make non-yielding gold increasingly attractive.
Ongoing central bank gold buying has been a hot topic at the LBMA conference in Miami. Robert Armstrong of the Financial Times observed, “If you are a central bank and you see the U.S. government trying to turn the screws on another nation’s foreign reserves, you are going to start thinking about alternatives and how to protect your economy."
Armstrong went on to say, “I think diversification works for everyone, and after the U.S. dollar, gold is probably the only show in town.” That's an important message to central banks, and individual investors alike and should provide an ongoing source of demand.
The latest gains in gold bode well for tests above $2700 and attainment of previously established objectives at $2,705.62 and $2,718.42. Another Fibonacci projection is found at $2,732.55. With each new high, the $3,000 level looks increasingly appealing.
The previous high at $2,684.45 now provides initial support, protecting the low for the day at $2,673.42. Yesterday's low at $2,659.20 should be bolstered by the rising 20-day moving average by the end of the week. The 20-day is at $2,649.88 today.
Silver is consolidating below $32, weighed by another disappointing Chinese stimulus announcement and further evidence of weakness in the U.S. manufacturing sector. While the white metal has traded below yesterday's low and the 20-day moving average, new record highs in gold should help limit the downside.
I continue to believe the supply and demand fundamentals are positively aligned for silver. However, it may take a decisive announcement on stimulus from China to catapult silver back toward its record high near $50.
This year's move to a new 12-year high at $32.700 is a step in the right direction. More than 50% of the entire decline from $49.752 (Apr'11 high) to $11.703 (Mar'20 low) has already been retraced. The 61.8% retracement level of that move is at $35.217 and becomes my next significant target upon a breach of $32.700.
In an interview in the Jerusalem Post, Rick Rule made note of Russia's recently stated intention to buy silver as a reserve asset, suggesting other central banks are interested in silver as well.
"When silver does break out, it's truly an amazing financial circumstance for those speculators who can afford it and those speculators who have the emotional stability to handle the volatility that you're going to see in the silver market," said Rule. His caution about silver market volatility should be heeded.
Dips within the range should continue to attract buying interest. I still see $30.950/856 as a formidable downside barrier in the short term.
Peter A. Grant
Vice President, Senior Metals Strategist
Zaner Metals LLC
Tornado Precious Metals Solutions by Zaner
312-549-9986 Direct/Text
[email protected]
www.ZanerPreciousMetals.com
www.TornadoBullion.com
X: @GrantOnGold
X: @ZanerMetals
Facebook: @ZanerPreciousMetals
Non-Reliance and Risk Disclosure: The opinions expressed here are for general information purposes only and should not be construed as trade recommendations, nor a solicitation of an offer to buy or sell any precious metals product. The material presented is based on information that we consider reliable, but we do not represent that it is accurate, complete, and/or up-to-date, and it should not be relied on as such. Opinions expressed are current as of the time of posting and only represent the views of the author and not those of Zaner Metals LLC unless otherwise expressly noted.
10/16/2024
Gold sets record highs against multiple currencies, but the dollar high holds for now
OUTSIDE MARKET DEVELOPMENTS: This week's generally weak EU and UK inflation readings have sent yields lower as the trade contemplates the likelihood of more aggressive ECB and BoE easing into year-end.
The ECB will announce policy tomorrow and another 25 bps cut is widely anticipated. The Bank of Canada is expected to cut next week. The Fed and the BoE are both expected to ease on 07-Nov.
The BoJ is an outlier that began a tightening campaign earlier this year. There is scope for another hike on 30-Oct.
Broadly speaking, interest rates are heading lower as inflationary pressures ebb, albeit slowly. While this is allowing central banks to focus more on growth risks, it will be some time before monetary policy is truly accommodative.
U.S. export prices fell 0.7% in September, outside expectations of -0.6%, versus a revised -0.9% in August (was -0.7%). Import prices fell 0.4% on expectations of -0.3%, versus a revised -0.2% in August (was -0.3%). Import prices ex-petro rose 0.2%.
U.S. mortgage applications plunged 17.0% in the week ended 11-Oct according to the Mortgage Bankers Association. Both purchase and refis fell as 30-year mortgage rates continued to rebound, reaching a 9-week high of 6.52%.
It looks like the mortgage market got ahead of itself and is correcting. This poses a headwind for home sales.
Chinese shares remain under pressure as investors lose patience with Beijing. The PBoC injected C¥642.4 bln in liquidity via seven-day reverse repos in an effort to shore up the market.
The South China Morning Post reports "Some prominent economists have called for China to roll out a stimulus plan worth 10 trillion yuan ($1.4 trillion)." Anything close to that would certainly get the market's attention and would send shares and commodities soaring.
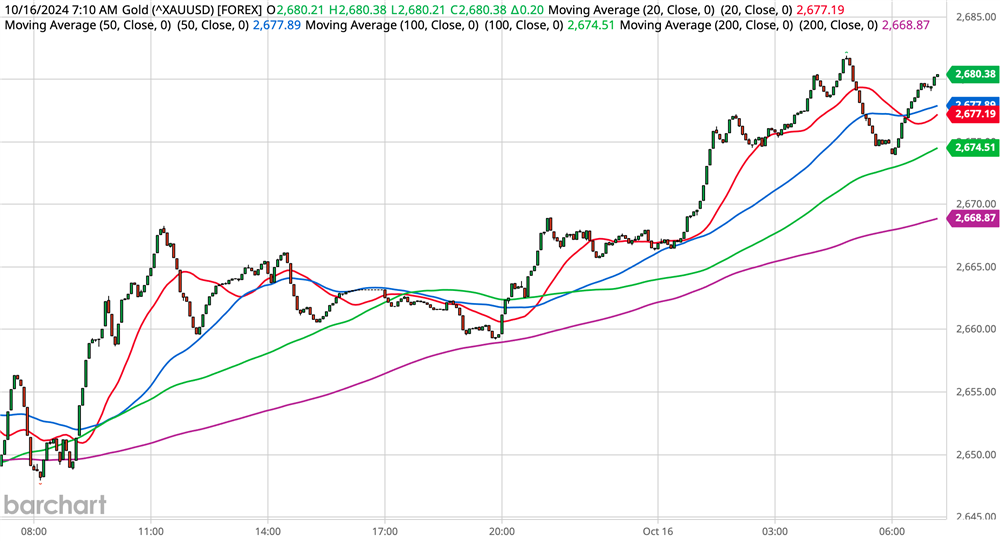
GOLD
OVERNIGHT CHANGE THROUGH 6:00 AM CDT: +$11.61 (+0.44%)
5-Day Change: +$64.17 (+2.46%)
YTD Range: $1,986.16 - $2,684.45
52-Week Range: $1,812.39 - $2,684.45
Weighted Alpha: +36.90
Gold approached the $2,684.45 record high in early U.S. trading. While the yellow metal was unable to set a new high against the dollar, it did reach fresh records against the euro, pound, C$, yen, yuan, rupee, and others.
I believe a new all-time high against the dollar is just a matter of time. The dollar is benefitting from safe-haven interest along with gold, but I continue to be impressed with gold's resilience in the face of that dollar strength.
A survey of the delegates at the LBMA conference in Miami projects gold will reach $2,941 over the next 12 months. I think gold could reach $3,000 as soon as Q1'25.
The fourth quarter is a seasonally significant period where we typically see heightened demand from festival and wedding-related buying out of India. Clarification of China's stimulus intentions could provide a boost to the market as well. Certainly, anything close to C¥10 trillion would likely send gold sharply higher.
John Lee, chief executive of the Hong Kong Special Administrative Region, said Hong Kong will become a major international gold trading center. China is already the largest producer and consumer of gold and has aspirations of becoming the global trading hub. The Shanghai Gold Exchange has gained prominence since opening in 2002 and is already the world's largest purely physical spot exchange.
The anticipated breach of $2,684.45 would favor an upside extension to a measuring objective off the recent correction at $2,718.42. Beyond the latter, I have a Fibonacci projection at $2,732.55.
An intraday chart point at $2,668.37 provides intervening support ahead of the overseas low at $2,659.20. Tuesday's low at $2,639.35 is bolstered by the 20-day moving average that comes in at $2,644.74 today.
SILVER
OVERNIGHT CHANGE THROUGH 6:00 AM CDT: +0.298 (+0.95%)
5-Day Change: +$1.226 (+4.02%)
YTD Range: $21.945 - $32.700
52-Week Range: $20.704 - $32.700
Weighted Alpha: +37.41
Silver tested back above $32 today, but those gains once again proved unsustainable. I'm beginning to feel that a sustained push above $32 and a breach of the 12-year high at $32.700 may be dependent on China announcing additional stimulus measures.
I do think such an announcement is forthcoming, making dips within the recent range buying opportunities. Attendees of the LBMA conference in Miami think silver could reach $45 over the next year. That would be more than a 40% rise from the present level.
Such a move seems likely based on the realities of supply and demand. Demand for industrial and green applications continues to rise. Mining output and recycling have not been able to keep pace, leading to structural deficits for the past four years. If demand is greater than supply, the price must rise.
Yesterday's close above the 20-day moving average provided some impetus for the test above $32. An eventual breach of $32.70 would initially shift focus to $33.372 based on a Fibonacci projection.
Former resistance at $31.620/615 now marks first support, protecting the intraday low at $31.434. More substantial support is well-defined at $30.950/856.
Peter A. Grant
Vice President, Senior Metals Strategist
Zaner Metals LLC
Tornado Precious Metals Solutions by Zaner
312-549-9986 Direct/Text
[email protected]
www.ZanerPreciousMetals.com
www.TornadoBullion.com
X: @GrantOnGold
X: @ZanerMetals
Facebook: @ZanerPreciousMetals
Non-Reliance and Risk Disclosure: The opinions expressed here are for general information purposes only and should not be construed as trade recommendations, nor a solicitation of an offer to buy or sell any precious metals product. The material presented is based on information that we consider reliable, but we do not represent that it is accurate, complete, and/or up-to-date, and it should not be relied on as such. Opinions expressed are current as of the time of posting and only represent the views of the author and not those of Zaner Metals LLC unless otherwise expressly noted.
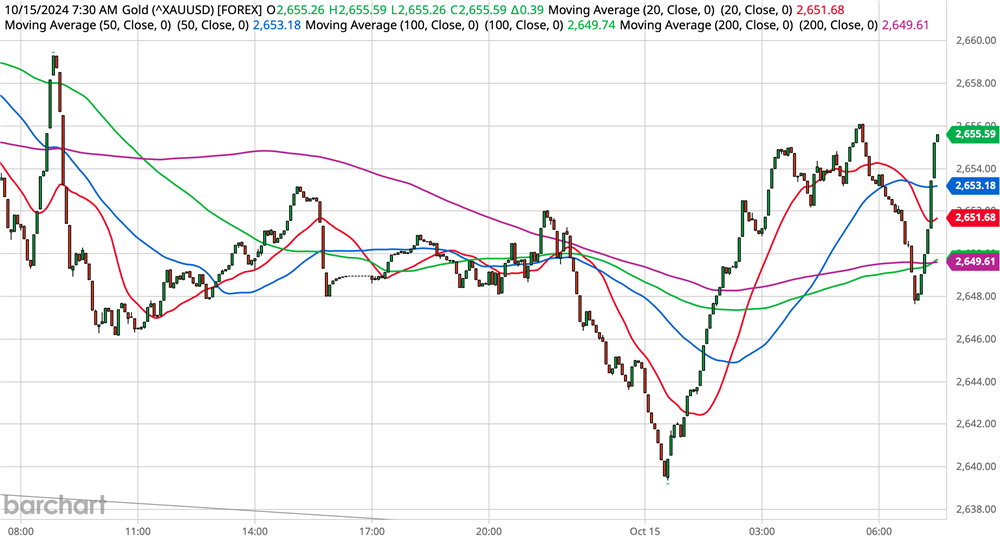
10/15/2024
Gold and silver firm despite dollar strength
OUTSIDE MARKET DEVELOPMENTS: In what the AP called a "symbolic display of anger," North Korea blew up unused sections of roads and rail lines that once linked the two Koreas. The action prompted the South Korean military to fire warning shots.
North Korea was angered this week by anti-north leaflets being dropped by drones over its capital Pyongyang. Seoul has not taken responsibility for the drone flights, but civilization unification groups frequently send propaganda north by balloon. The North sends trash balloons south in retaliation.
North Korean leader Kim Jong Un has accused South Korea and the U.S. of provoking hostilities in the region because of their tighter military ties. Kim has threatened to use the country's nuclear weapons in the event of a conflict.
China surrounded Taiwan on Monday with warplanes and warships to simulate a blockade as part of a large-scale one-day military drill. Chinese military drills around Taiwan have become increasingly frequent in recent years. Taipei and Washington have condemned China for raising tensions in the region.
With the Russia-Ukraine conflict raging, NATO began its annual nuclear exercise on Monday ramping up tensions on the Continent. NATO Secretary General Mark Rutte said the exercise is a display of the alliance's deterrence capabilities.
That messaging is clearly aimed at Russia. A Russian government spokesman said the "exercises lead to nothing but further escalation of tension."
All these factors, along with Israel's ongoing multifront war against regional terrorists, have global geopolitical risks quite high at the moment. Safe haven assets such as gold, the Swiss franc, and the dollar have seen stronger buying interest.
Canadian CPI fell 0.4% m/m in September, below expectations of -0.2%, versus -0.2% in August. The annualized pace of consumer inflation eased to 1.6% from 2.0% in August, the lowest since Feb'21. This raises the likelihood of a 50 bps rate cut by the BoC next week.
U.S. Empire State Index tumbled 23.4 points in October to a five-month low of -11.9, well below expectations of 3.0, versus 11.5 in September. However, optimism about the six-month outlook rose to a 25-month high of 38.7.
NY Fed Empire State Manufacturing Survey

The evidence of weakness in the manufacturing sector didn't impact Fed policy expectations much. The market is still widely anticipating an additional 50 bps points in easing through year-end, evenly divided into 25 bps cuts in November and December.
Fed Governor Christopher Waller worried yesterday that the economy is not cooling at the central bank's desired pace. "I view the totality of the data as saying monetary policy should proceed with more caution on the pace of rate cuts than was needed at the September meeting,” Waller said.
GOLD
OVERNIGHT CHANGE THROUGH 6:00 AM CDT: +4.67 (+0.18%)
5-Day Change: +$36.83 (+1.40%)
YTD Range: $1,986.16 - $2,684.45
52-Week Range: $1,812.39 - $2,684.45
Weighted Alpha: +35.95
Gold firmed to a two-week high as the trade reduced bets on steady Fed policy in November after a weak Empire State reading. The yellow metal approached the high for the month at $2,670.67 (01-Oct) before retreating into the range.
Gold remains supported by heightened geopolitical tensions and continues to shrug off strength in the dollar. The dollar index remains well-bid after setting an 11-week high on Monday at 103.36. The last time DXY was above 103.30 was 08-Aug. Gold closed at $2,427.04 that day.
Talk out of the London Bullion Market Association's annual conference in Miami indicates that official sector buying is likely to remain a tailwind for the gold market. Reserve diversification is a primary motivation for central bank purchases.
A breach of initial resistance at $2,670.67 would clear the way for a retest of the record high at $2,684.45 (26-Sep). Penetration of the latter would bode well for an upside extension to a measuring objective off the recent correction at $2,718.42. New record highs would also boost confidence in the longer-term target at $3,000.
Today's overseas low at $2,639.35 protects the more important $2,628.36 low from Friday. Key short-term support is well defined at $2,606.62/$2,604.09.
Silver has once again bounced from intraday tests below $31 helped by strength in gold. While the breach of resistance at $31.537/615 is encouraging, ongoing worries about the state of the Chinese economy and weakness in U.S. manufacturing pose headwinds.
Beijing continues to promise it will take appropriate measures to reach its 5% growth goal, but the market is keen to hear plan specifics. Simple jawboning over the past week has resulted in some degree of uncertainty.
A close above the 20-day moving average at $31.361 today would provide some additional technical encouragement. A move back above $32 is needed to clear the way for a retest of the 12-year high at $32.700 (04-Oct).
On the downside, keep an eye on $31.361 on a close basis. This level protects the more important $30.950/856 zone.
Peter A. Grant
Vice President, Senior Metals Strategist
Zaner Metals LLC
Tornado Precious Metals Solutions by Zaner
312-549-9986 Direct/Text
[email protected]
www.ZanerPreciousMetals.com
www.TornadoBullion.com
X: @GrantOnGold
X: @ZanerMetals
Facebook: @ZanerPreciousMetals
Non-Reliance and Risk Disclosure: The opinions expressed here are for general information purposes only and should not be construed as trade recommendations, nor a solicitation of an offer to buy or sell any precious metals product. The material presented is based on information that we consider reliable, but we do not represent that it is accurate, complete, and/or up-to-date, and it should not be relied on as such. Opinions expressed are current as of the time of posting and only represent the views of the author and not those of Zaner Metals LLC unless otherwise expressly noted.
10/14/2024
Gold remains within site of record highs amid heightened geopolitical risks
OUTSIDE MARKET DEVELOPMENTS: The U.S..bond market, the Fed, and banks are closed today for the Columbus Day holiday. The U.S. stock market is open.
Canadian markets are closed for Thanksgiving.
Japan markets were closed for Health/Sports Day.
North Korea has accused South Korea of flying drones over Pyongyang and dropping anti-North leaflets. The North is viewing this as a serious provocation and is said to be preparing to blow up roads and cut rail lines that connect the two countries. Pyongyang has also put border artillery units on high alert and has threatened retaliation if the incitements continue.
China's military launched a new round of war games near Taiwan as a warning against the "separatist acts of Taiwan independence forces." Bejing said further action was possible, "until the Taiwan issue is completely resolved." The PLA drills have drawn strong condemnation from Tapei and Washington.
Over the weekend, the Chinese government promised additional economic stimulus to achieve its growth goals. However, Beijing again failed to deliver the specifics the market was craving.
Last week's U.S. inflation data were benign for the most part, and the market continues to expect a 25 bps rate cut from the Fed in November. The prospects for steady policy stand at 15.9%.
The unwinding of bets that favored more aggressive Fed easing continues to lift the dollar. The dollar index set new 8-week highs in overseas trading and is threatening to move above the 100-day moving average for the first time since July.
This week's key U.S. economic reports are Sep retail sales (+0.3% expected) and Sep industrial production (-0.1%). Both come out on Thursday.
GOLD
OVERNIGHT CHANGE THROUGH 6:00 AM CDT: -$0.04 (0.00%)
5-Day Change: +$9.76 (+0.37%)
YTD Range: $1,986.16 - $2,684.45
52-Week Range: $1,812.39 - $2,684.45
Weighted Alpha: +35.52
Gold is consolidating last week's rebound and thin holiday conditions are expected to prevail once London closes. Last week's corrective setback stalled in front of the $2,600 level, leaving the yellow metal within striking distance of the all-time high at $2,684.45.
Heightened tensions between the Koreas along with China's latest intimidation of Taiwan add to the already high geopolitical risk environment. Haven interest should continue to provide a solid underpinning for the gold market.
While dollar strength is seen as a headwind, I continue to be impressed by gold's resilience. The last time the dollar index was above 103.20, gold was trading nearly $200 lower than its current price.
Global ETFs saw net outflows of 6.4 tonnes last week. Modest inflows of 2.1 tonnes from North American investors were eclipsed by European and Asian outflows.

The COT report for last week saw the net speculative long position reduced by 21.7k to 278.2k contracts. It was the second consecutive weekly decline.
CFTC Gold speculative net positions

The recent corrective activity in gold provides an upside measuring objective of $2,718.42. The high from October 1 at $2,670.67 and the record high at $2,684.45 (26-Sep) provide intervening barriers.
Today's intraday low at $2,644.62 protects the more important $2,628.36 low from Friday. Key short-term support is now well defined at $2,606.62/$2,604.09.
SILVER
OVERNIGHT CHANGE THROUGH 6:00 AM CDT: -0.258 (-0.82%)
5-Day Change: -$0.526 (-1.66%)
YTD Range: $21.945 - $32.700
52-Week Range: $20.704 - $32.700
Weighted Alpha: +34.05
Silver dipped briefly back below $31 in overseas trading as weekend talk of Chinese stimulus was disappointingly vague. While the ongoing jawboning suggests additional measures to spur growth will be forthcoming, the trade is keen to hear the specifics.
Dollar strength and geopolitical tensions are seen as potentially limiting factors on the upside. However, gold's resilience provides at least a modicum of support.
The COT report for the week ended 11-Oct revealed a 2.2k decline in silver's net speculative long position to 54.7k contracts. It was the second consecutive weekly decline off of the more than four-year high of 62.2k contracts from the 27-Sep week.
CFTC Silver speculative net positions

A close back above the 20-day moving average at $31.318 and a breach of resistance at $31.615 would shift focus to more important chart/Fibonacci resistance at $31.713/756. Penetration of the latter would bode well for further tests above $32.00 and eventually fresh 12-year highs above $32.700.
Today's low at 30.950 now provides a good intervening barrier ahead of the corrective low from last week at $30.229. The 50- and 100-day moving averages have converged at $29.770/760 and mark another important support to watch.
Peter A. Grant
Vice President, Senior Metals Strategist
Zaner Metals LLC
Tornado Precious Metals Solutions by Zaner
312-549-9986 Direct/Text
[email protected]
www.ZanerPreciousMetals.com
www.TornadoBullion.com
X: @GrantOnGold
X: @ZanerMetals
Facebook: @ZanerPreciousMetals
Non-Reliance and Risk Disclosure: The opinions expressed here are for general information purposes only and should not be construed as trade recommendations, nor a solicitation of an offer to buy or sell any precious metals product. The material presented is based on information that we consider reliable, but we do not represent that it is accurate, complete, and/or up-to-date, and it should not be relied on as such. Opinions expressed are current as of the time of posting and only represent the views of the author and not those of Zaner Metals LLC unless otherwise expressly noted.