• +1 (312) 549-9986

Gold $2,331.36 $(0.65) -0.03% Silver $27.22 $(0.17) -0.62% Platinum $915.68 $(0.27) -0.03% Palladium $962.79 $(19.28) -1.96%
RSS

Blog posts tagged with 'recession'

Grant on Gold – September 18, 2023
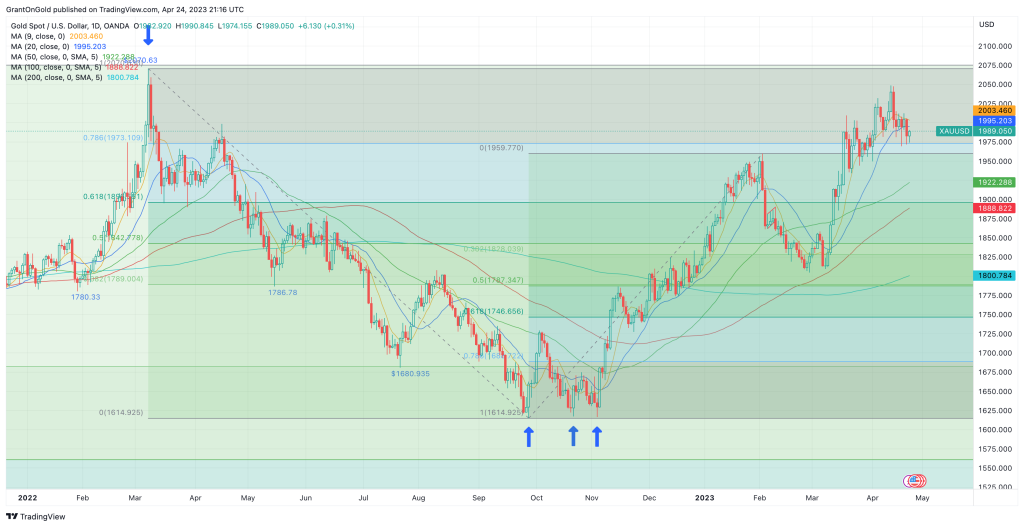
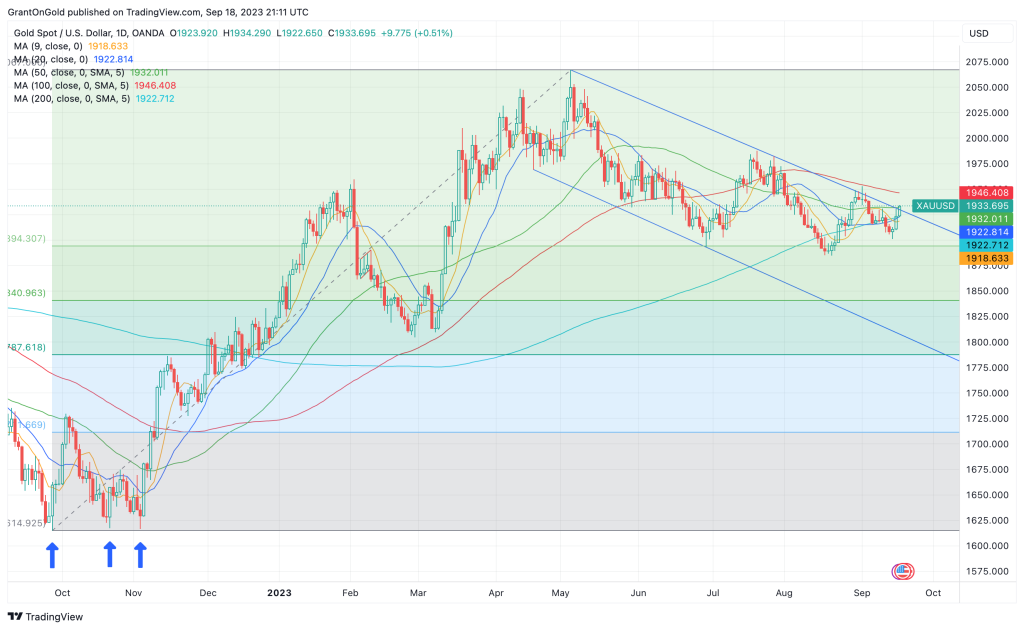
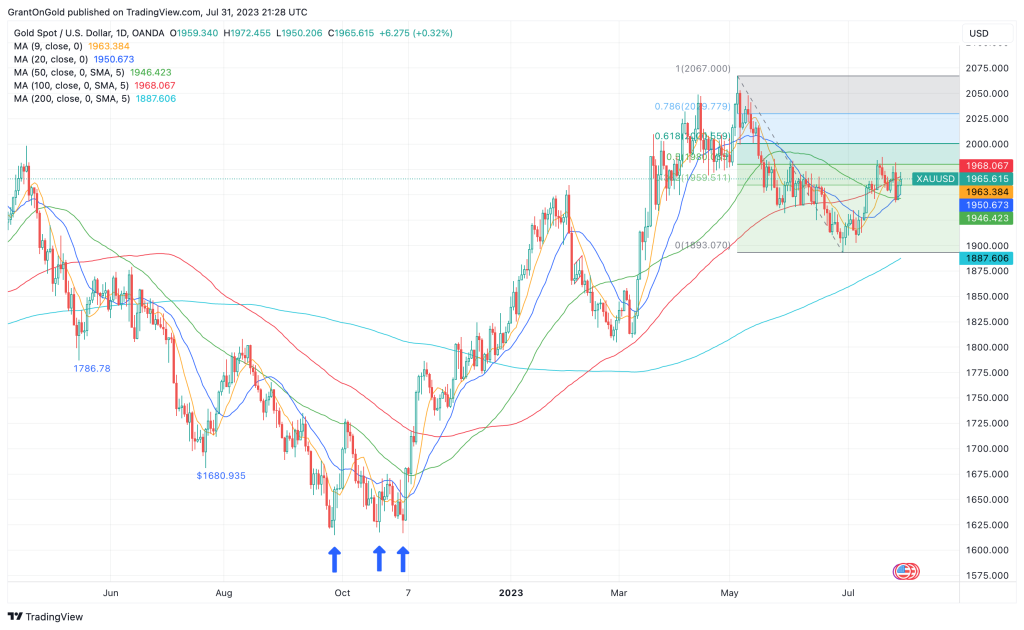
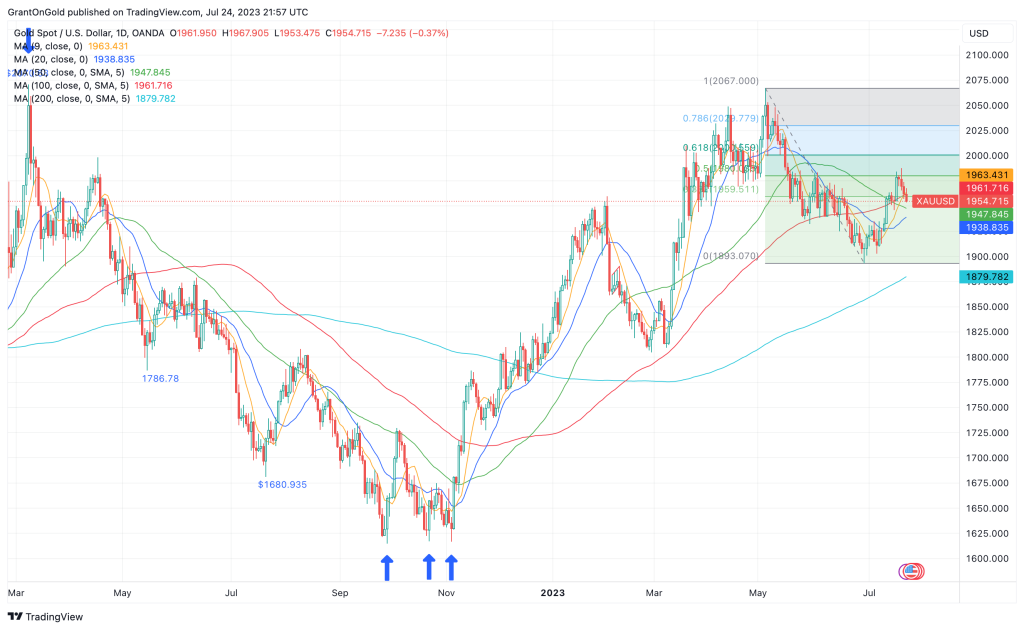
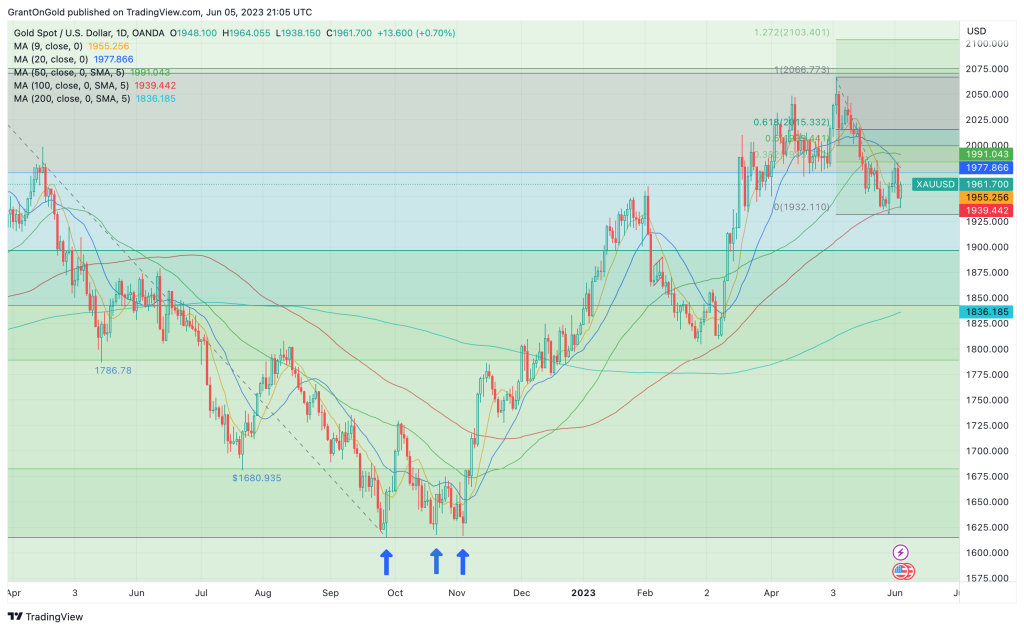
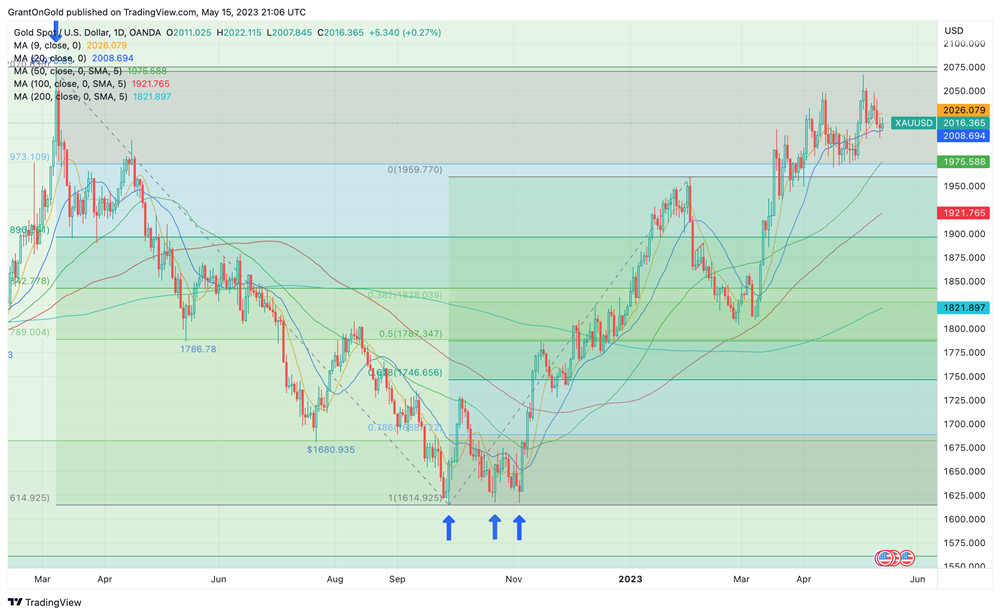
Monday, September 18, 2023

Gold has been unable to sustain tests below $1900 in recent weeks. While it’s premature to suggest the corrective low is in place at $1884.88 (21-Aug), support is now clearly defined. The yellow metal traded as low as $1901.05 last week which now marks a good intervening support level.

Spot Gold Daily Chart through 09/13/23

Gold has garnered some lift from revived inflationary pressures, uncertainty associated with the UAW strike, and the latest risk of a government shutdown.

Annualized CPI rose to 3.7% in August, versus 3.2% in July. PPI jumped to 1.6% y/y from 0.8% in July. Gas prices have reached new highs for the year at a time when ebbing seasonal demand should be tamping the price.

Production cuts by Saudi Arabia and Russia, along with severe flooding in Libya have squeezed supply and pushed crude to 10-month highs, approaching $100 per barrel. The price has risen at the fastest pace since Russia invaded Ukraine last year.

Gold is pressuring the upper reaches of the broad corrective channel. A move back above the 100-day MA at $1945.59, and perhaps more importantly the $1953.06 high from 01-Sep would set a more favorable tone within the range.

Despite resurgent inflation, Fed funds futures indicate that the central bank will hold steady when they announce policy this week. The probability of steady policy is currently at 99%.

Heightened growth risks, seem to be offsetting inflationary pressures. If Fed funds remain at 5.25-5.50%, market participants will turn to the policy statement and the projections for clues as to the Fed’s next move.

Not surprisingly, risks to growth along with stubborn inflation have led to heightened talk about stagflation. During the last bout of stagflation, which occurred in the 1970s, gold was one of the best-performing assets.

It is reasonable to assume that gold will once again serve as a hedge, should stagflation rear its ugly head once again.  With gold less than 7% off its all-time high ($2075.28), the last several months of corrective to consolidative price action seem to present a favorable buying opportunity.
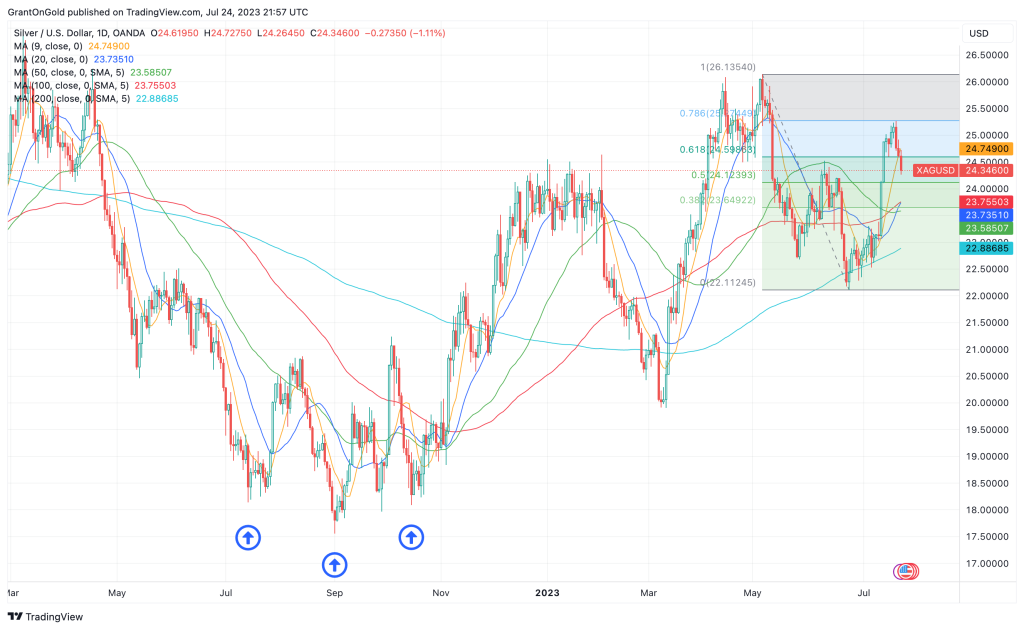
Silver

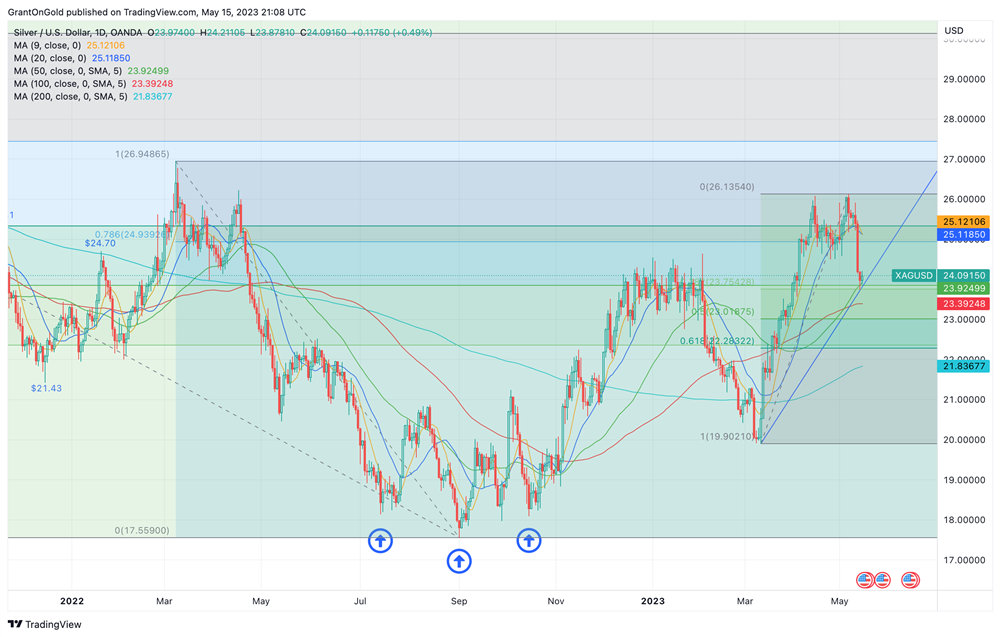
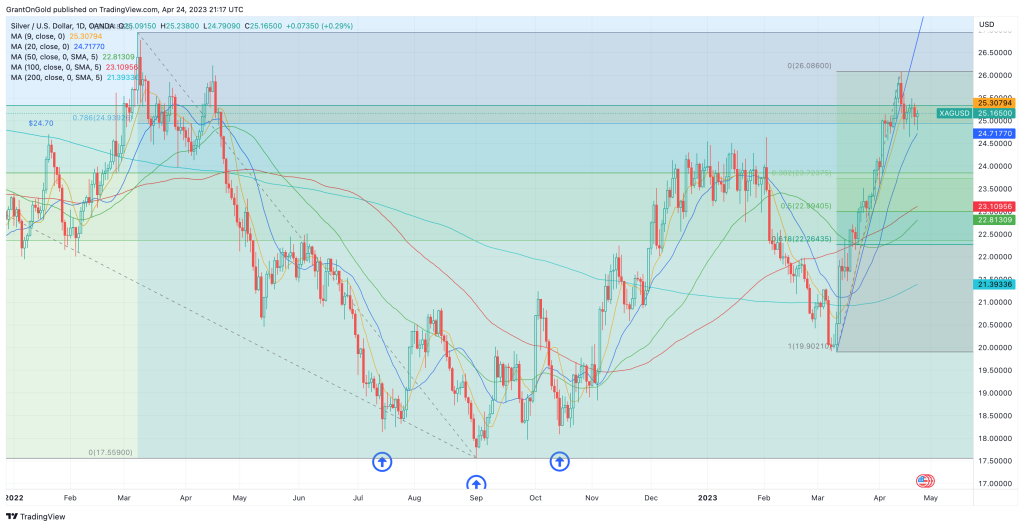
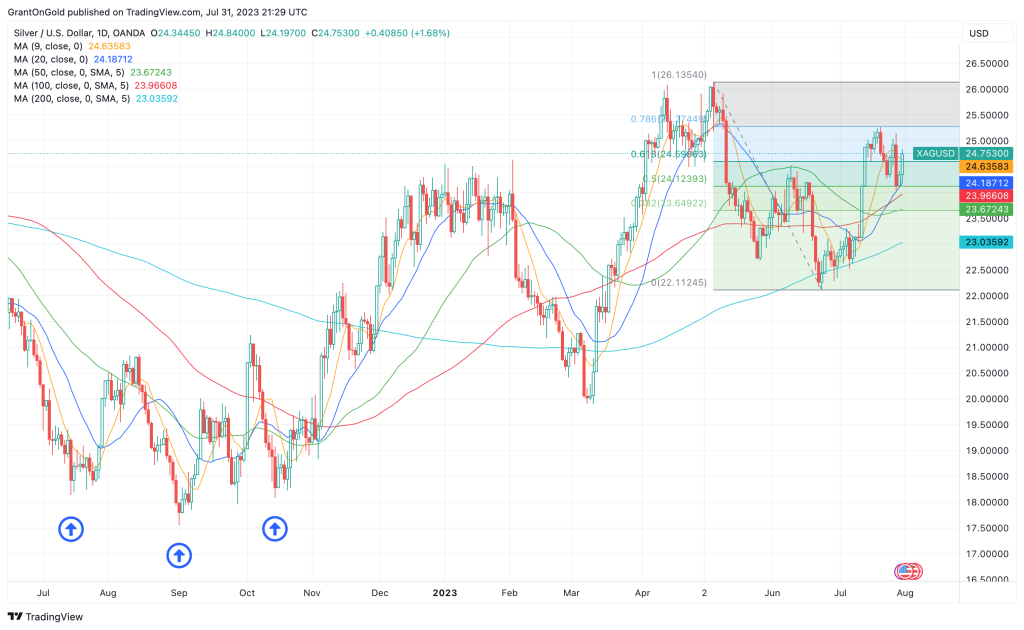
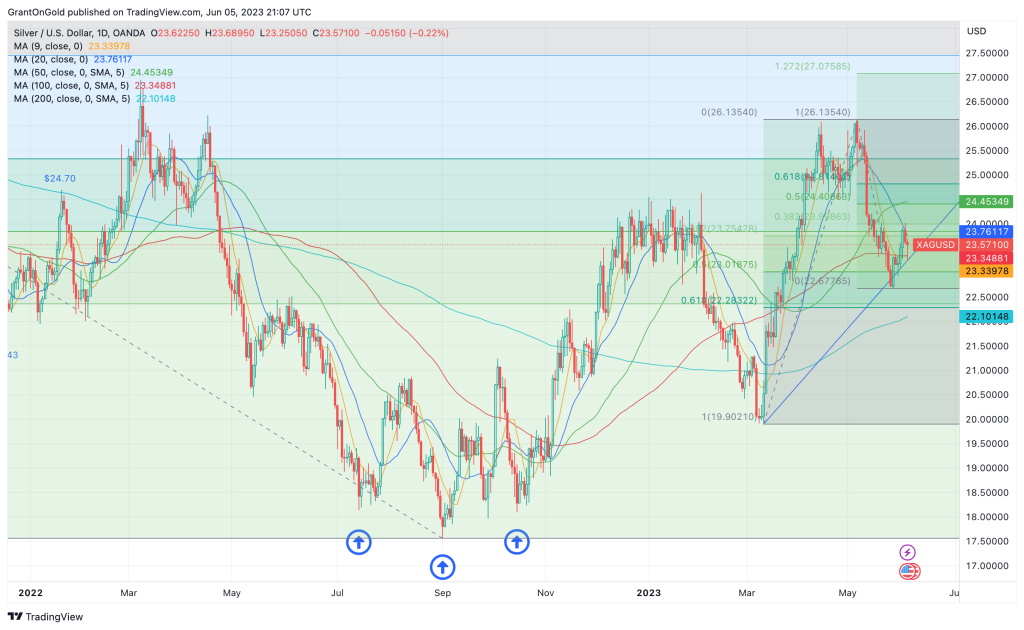
Silver unsuccessfully challenged important support at $22.22/11 last week before rebounding into the range. With this level intact, downside risk is clearly defined.

Spot Silver Daily Chart through 09/13/23

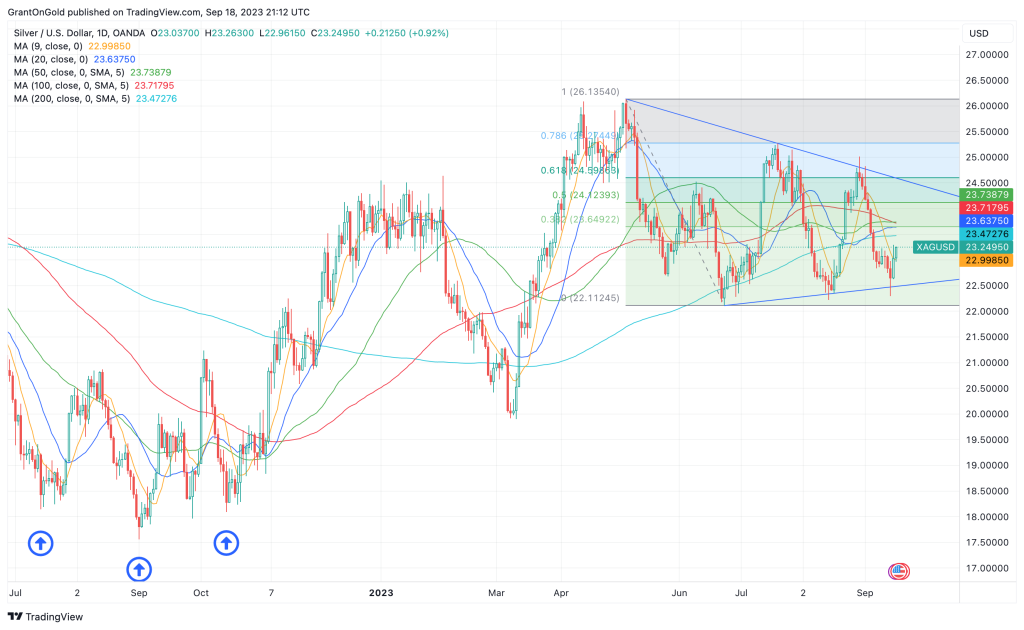
Worries about an economic slowdown are further exacerbated by the U.S. autoworker’s strike. While the auto industry will remain a huge source of demand for silver, the strike may sap demand in the short term.

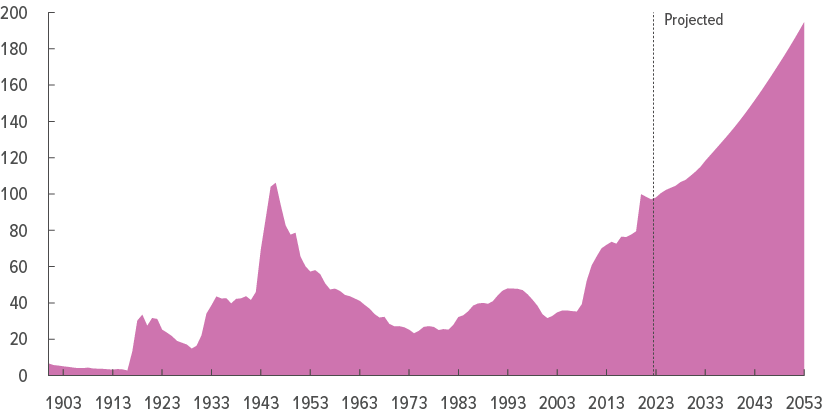
According to the Silver Institute, the auto industry consumes 60 Moz of silver annually. That figure is expected to grow to 90 Moz by 2025, driven largely by the rising demand for electric vehicles (EVs).

Conventional vehicles with internal combustion engines contain 15 to 28 grams of silver. On the other hand, the silver load in EVs can be as high as 50 grams.

Some more upbeat economic data out of China in August suggests the demand picture may be improving. That would bode well for silver and other industrial metals, but many analysts worry that the property slump is likely to persist, leading to an ongoing drag on the economy.

A rebound above $24 would put silver back above all the major moving averages, setting a more positive technical tone within the large developing triangle pattern. Given the long-term supply and demand fundamentals, an eventual upside breakout of this pattern is still preferred.
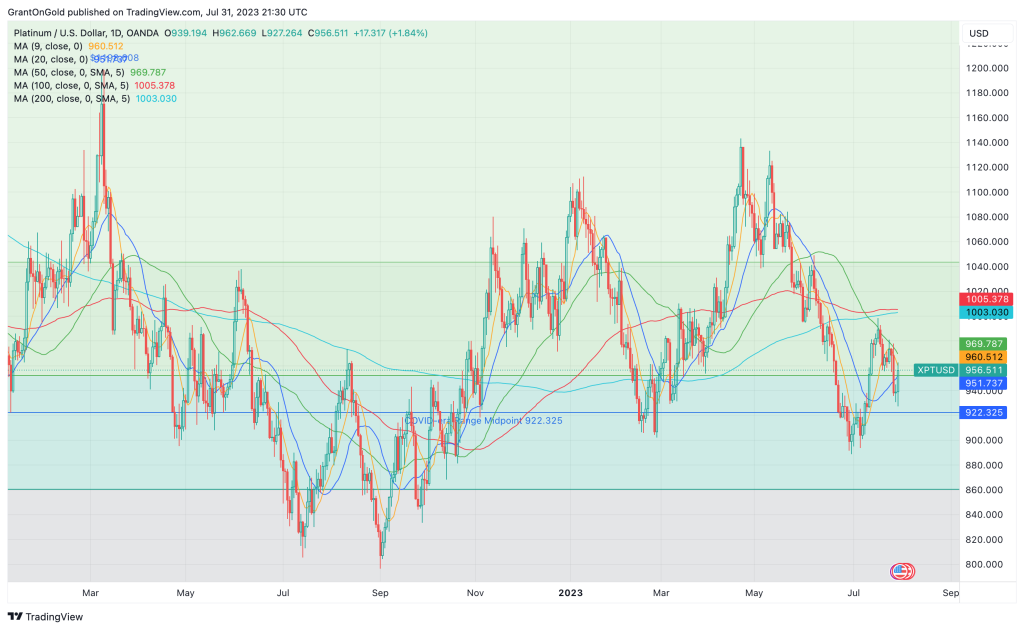
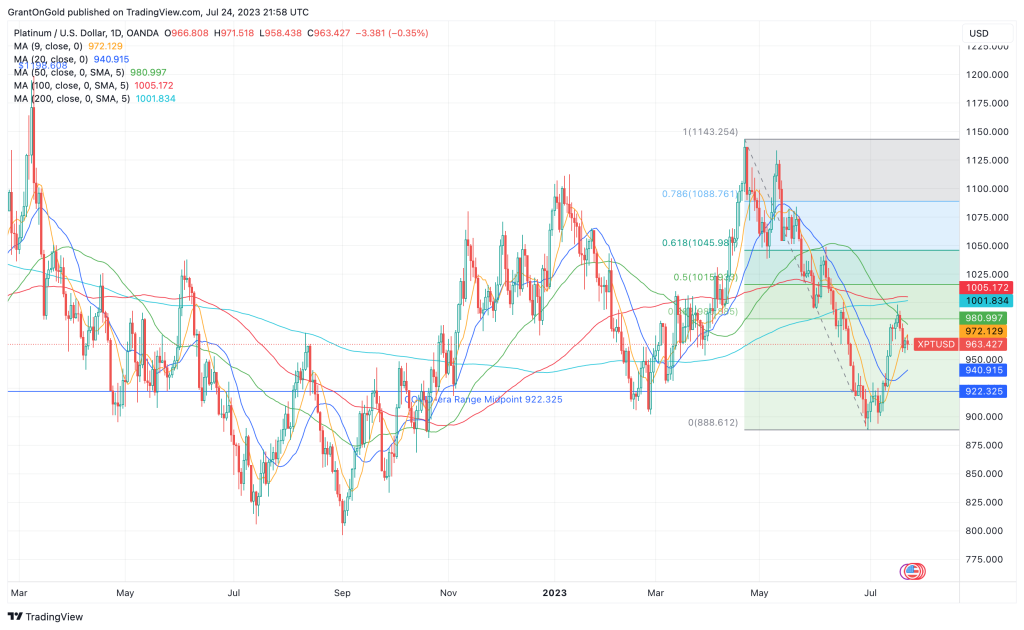
PGMs

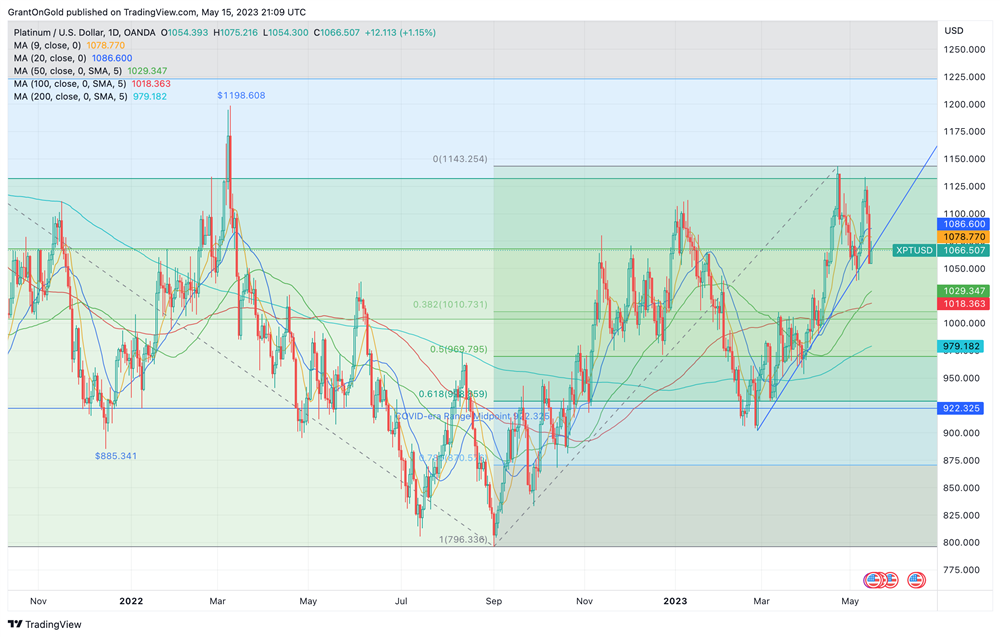
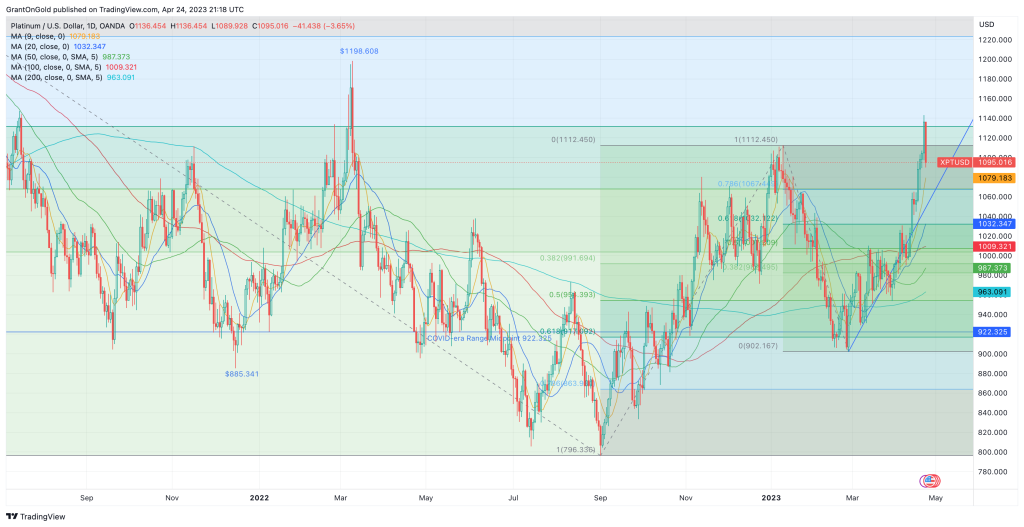
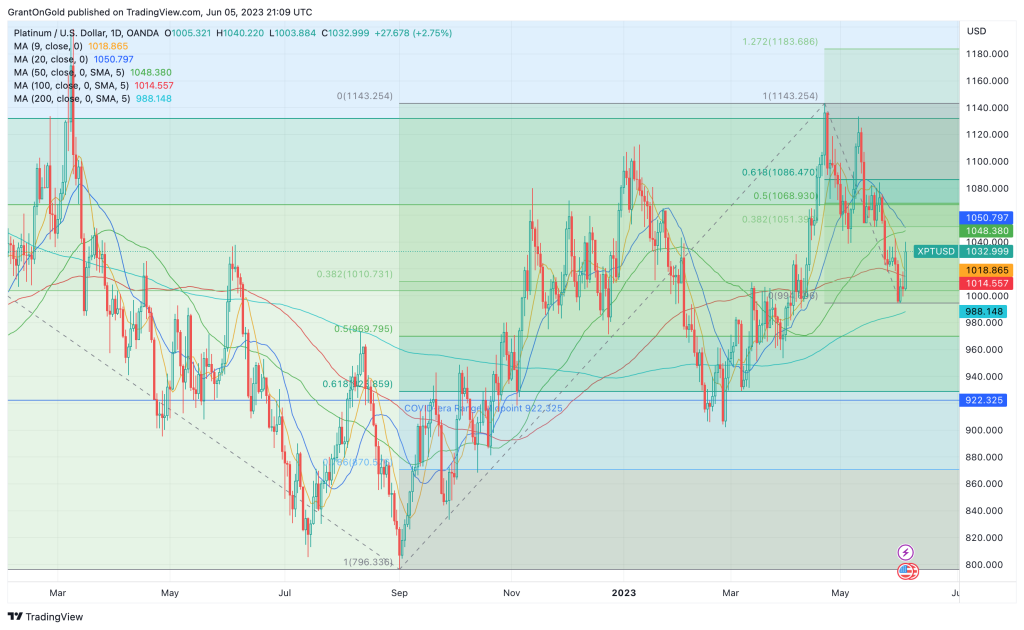
Platinum rebounded nearly 4% last week, leaving a potential inverse head-and-shoulders pattern. A breach of the neckline around $990 is needed to confirm the formation, which would have bullish implications. Upside potential would be $1107.68 based on a measuring objective.

Spot Platinum Daily Chart through 09/13/23

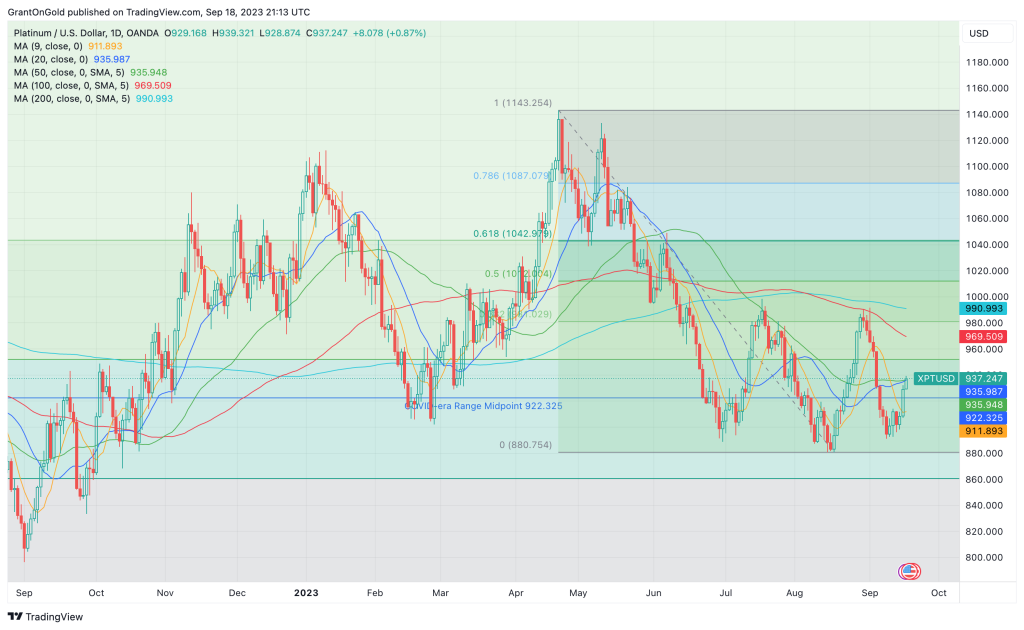
A soft landing in the U.S. along with an end to the autoworkers strike would provide fundamental support to this scenario, as would a sustained recovery in China.

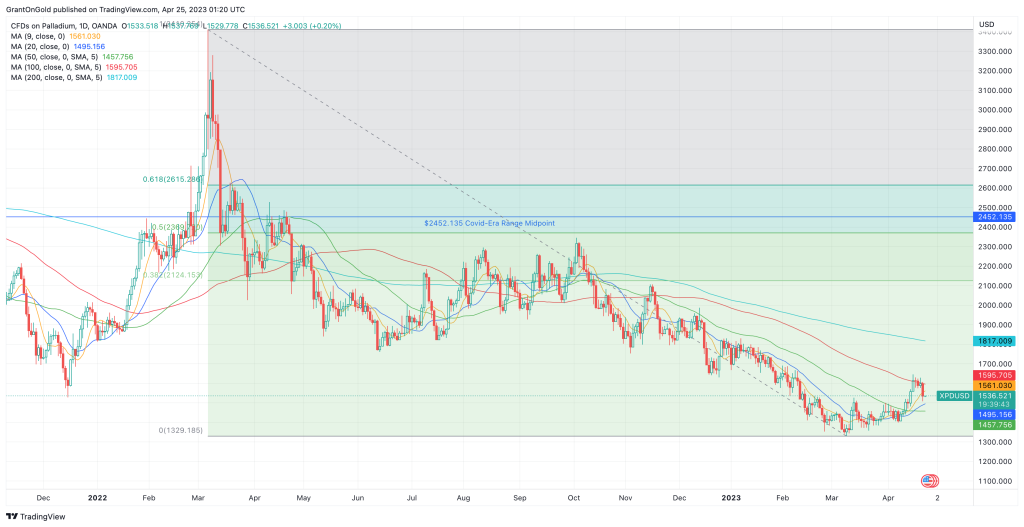
Palladium remains defensive after falling to nearly a 5-year low early in September. The autoworkers’ strike adds additional pressure to an already bleak demand environment.


Non-Reliance and Risk Disclosure: The opinions expressed here are for general information purposes only and should not be construed as trade recommendations, nor a solicitation of an offer to buy or sell any precious metals product. The material presented is based on information that we consider reliable, but we do not represent that it is accurate, complete, and/or up-to-date, and it should not be relied on as such. Opinions expressed are current as of the time of posting and only represent the views of the author and not those of Zaner Metals LLC unless otherwise expressly noted.

Grant on Gold – July 31, 2023
Monday, July 31, 2023

Gold is consolidative just below the midpoint of the May-June range as the market assesses the implications of last week’s Fed rate hike and better-than-expected economic data. The yellow metal ends July with a gain of 2.4%, breaking a 2-month losing streak.

Spot Gold Daily Chart through 7/31/2023

Last week the Fed hiked rates by 25 bps, and it was widely accepted it would be the last one for some time. However, on Thursday Q2 advance GDP came in at 2.4%, above expectations of 1.9%. In addition, durable goods orders surged 4.7% in June, well above market expectations of 1.8%.

These robust data are evidence that the U.S. economy continues to hum along at a respectable pace, despite the marked rise in interest rates over the past 16 months. More hawkish members of the Fed could now conceivably argue there is room for another rate hike. Fed funds futures are currently showing a 20% probability for a 25-bps hike in September.

While the Fed’s favored measure of inflation cooled to 4.1% in June, versus 4.6% in May, there are lingering worries in the market that a second wave of inflation could be in the offing. The national average for a gallon of regular gas jumped 13¢ last week reaching an 8-month high.

I’m often asked why gold didn’t fare better during this inflationary period. The answer lies in the Fed’s aggressive response in raising the Fed funds rate by 525 bps in just over a 1-year period. During that time, gold only corrected 22%, from $2070.63 (just shy of the all-time high) to $1614.92.

Most of those corrective losses have already been retraced, so I would argue that gold held up remarkably well in the face of the most aggressive tightening campaigns in recent history.

The long-term trend remains bullish with the market trading less than $110 off the all-time high. Setbacks into the range are likely to be viewed as buying opportunities.

Silver

Silver closed down more than 1% last week, weighed by persistent concerns that the health of the Chinese economy, and an uptick in the probability of another Fed rate hike in September.

Spot Silver Daily Chart through 7/31/2023

A firmer tone emerged over the past two sessions on the heels of strong U.S. and Japanese data. While the Chinese economy continues to show signs of weakness, the government announced supports for light industry on Friday and then measures to boost consumer spending on Monday.

Such stimulus offers support for both precious and industrial metals. If the Chinese economy continues to struggle, additional (and larger) stimulus would be likely, providing underpinning for the metals.

I like that the 20-day SMA successfully contained the downside last week. Renewed tests above $25 would bode well for a retest of the high from July 20 at $25.27. Penetration of the latter would clear the way for a challenge of the highs for the year at $26.09/14.

PGMs

Platinum fell 2.8% last week, notching a second consecutive lower weekly close. A fresh 2-week low was set on Monday before the market snapped back to close nearly 2% higher on the day.

Spot Platinum Daily Chart through 7/31/2023

The outside day with a higher close bodes well for upside follow-through on Tuesday. Strong economic data from the U.S. and Japan, along with Chinese stimulus are supportive factors.

The longer-term supply and demand dynamics remain broadly supportive. Dips into the range are likely to be viewed as buying opportunities.

Palladium has been corrective to consolidative over the past several weeks. While a short-term bottom may be in place at $1185.18, the trend remains bearish.


Non-Reliance and Risk Disclosure: The opinions expressed here are for general information purposes only and should not be construed as trade recommendations, nor a solicitation of an offer to buy or sell any precious metals product. The material presented is based on information that we consider reliable, but we do not represent that it is accurate, complete, and/or up-to-date, and it should not be relied on as such. Opinions expressed are current as of the time of posting and only represent the views of the author and not those of Zaner Metals LLC unless otherwise expressly noted.

Grant on Gold – July 24, 2023
Monday, July 24, 2023

Gold’s focus this week is squarely on the FOMC meeting. The two-day meeting begins on Tuesday with the policy announcement and Chairman Powell’s press conference set for Wednesday.

Spot Gold Daily Chart through 7/24/2023

 In the eyes of the market, a 25-bps rate hike is a foregone conclusion. Fed funds futures reflect a probability of 98.3%. That is largely the result of the ongoing tempering of U.S. inflation data.

June CPI data showed a full-point drop in annualized consumer inflation to 3.0% from 4.0% in May. June PPI fell to 0.1% y/y, versus a downward revised 0.9% y/y in May.

The market is widely anticipating that Fed will pause after this week’s hike. The target rate is then most likely to remain at 5.25% – 5.5% into Q1-2024. However, the policy statement will undoubtedly state that the rate path will be data-dependent.

What comes next though? Arguably growth risks remain in light of the rather dramatic series of rate hikes over the past 16 months. On the other hand, Vincent Deluard of StoneX believes we “should brace for second and third inflationary waves, as was the case in the 50s and 70s.”

The yellow metal set a 9-week high last week shy of the $2000 level, buoyed by a weaker dollar. The dollar index tumbled to a 15-month low on the belief that the Fed is on the verge of pausing, while other major central banks will continue their tightening campaigns.

While gold and the dollar have adopted corrective tones in more recent sessions, I see this as primarily associated with position squaring ahead of the Fed decision. If the policy statement is in line with expectations ­– without an over-the-top emphasis on data dependency – the dominant trends should resume.

Silver

Silver closed down 1.3% last week. It was the first lower weekly close in four.

Spot Silver Daily Chart through 7/24/2023

A key reversal did form on Thursday last week, so it was not surprising to see downside follow-through late last week and into Monday. Here too, we suspect some profit-taking ahead of the FOMC meeting.

Heightened growth risks may be putting some pressure on the more industrial metals as well. Preliminary US manufacturing PMI for July came in better than expected at 49, but the indicator appears on track for a third consecutive month of contraction.

Meanwhile, services PMI slumped to 52.4, well below expectations of 54. It was the sixth straight month of expansion, but the slowest pace since March.

According to the report: “The overall rate of output growth, measured across manufacturing and services, is consistent with GDP expanding at an annualized quarterly rate of approximately 1.5% at the start of the third quarter. That’s down from a 2% pace signaled by the survey in the second quarter.”

While economic growth slowed in July, there are plenty clinging to the notion of a soft landing. Let’s just say that my confidence in the Fed’s ability to orchestrate such an outcome is not particularly high.

I’m also somewhat concerned about the ongoing lack of investor interest, despite the (near-perfect) 78.6% retracement of the May-June decline. ETF outflows last week totaled 6.4Moz, leaving net holdings down more than 2% YTD.

The longer-term supply/demand fundamentals remain broadly favorable, and setbacks are likely to be viewed as buying opportunities.

PGMs

Platinum fell 1.1% last week but not before establishing a 5-week high at $998.43. The inability of the market to regain $1000 leaves the upside limited while the market awaits the Fed’s decision.

Spot Platinum Daily Chart through 7/24/2023

Consolidative range trading persists. A rebound above $1000 would set a more favorable tone within the $564.70/$1339.35 range.

Palladium remains defensive near 4½-year lows.


Non-Reliance and Risk Disclosure: The opinions expressed here are for general information purposes only and should not be construed as trade recommendations, nor a solicitation of an offer to buy or sell any precious metals product. The material presented is based on information that we consider reliable, but we do not represent that it is accurate, complete, and/or up-to-date, and it should not be relied on as such. Opinions expressed are current as of the time of posting and only represent the views of the author and not those of Zaner Metals LLC unless otherwise expressly noted.

Grant on Gold – June 5, 2023
Monday, June 5, 2023

Gold remains defensive below the $2000 level as ongoing strength in the labor market keeps the threat of inflation highlighted. That in turn makes it difficult to rule out further rate hikes.

Spot Gold Daily Chart through 6/5/2023

U.S. nonfarm payrolls for May came in at a solid +339k, well above market expectations of +193k, versus a positively revised +294k in April. While the unemployment rate rose to 3.7%, strength in the payrolls numbers diminishes the likelihood that a recession is impending.

This also seems to provide some additional leeway for the Fed to further tamp inflation with another rate hike this month, although that’s not really being reflected in Fed funds futures yet. The CME’s FedWatch tool puts the probability of a 25-bps rate hike at 24.1% as of Monday.

The resolution of the latest debt-ceiling standoff has taken some of the haven bid out of gold. While default has been averted, there doesn’t seem to be any palpable sense of relief.

The debt ceiling has been suspended until January 2025, allowing Treasury to borrow as much as it wants until the debt ceiling is reinstated. The CBO projects total debt held by the public to grow to $27.4 trillion by the end of 2024 and exceed 100% of GDP. Gross debt is expected to be north of $34 trillion.

Federal Debt Held by the Public, 1900 to 2053

By the end of 2033, total debt held by the public is projected to rise to $46.4 trillion, and 118.2% of GDP. Gross debt at the end of 2033 will be approaching $52 trillion.

Those numbers and that chart – especially the trajectory – are reasons for considerable concern. The debt and the servicing costs are an ever-growing millstone around the neck of economic growth potential.

While this is certainly a grim reality for the U.S., the explosion of debt is a global phenomenon.

A recent report by the consultancy group McKinsey found that since 2000, “Globally, for every $1.00 of net investment, $1.90 of additional debt was created.” This was largely due to rising debt levels and quantitative easing (money printing). During 2020 and 2021, “The creation of new debt accelerated to $3.40 for each $1.00 in net investment.”

That’s pretty staggering. Not surprisingly, investors are wondering where they can turn to safeguard their wealth. A recent Bloomberg survey showed that 52% of professional investors and 46% of retail investors picked gold as their top safety choice. Treasuries were a distant second at 14% and 15% respectively.

According to a Gallup poll gold has vaulted into second place for the best long-term investment, behind real estate. According to the poll, gold is now comfortably favored above stocks/mutual funds, Savings accounts/CDs, and bonds.

It’s worth recalling that the world’s central banks have been buying gold voraciously. Central Bank gold buying reached a record 1,078 tonnes in 2022. This year is off to a strong start as well, with Q1 demand hitting a record 228 tonnes, 34% higher than the previous Q1 record set in 2013.

While much has been said in recent weeks about gold weakness stemming from a stronger dollar, keep in mind that the yellow metal is only about $100 (less than 6%) off its all-time high of $2075.28. Savvy investors will likely view short-term setbacks as buying opportunities.

Silver

Silver ended May with a loss of 6%. It was the first lower monthly close in three, as uncertainty over the debt ceiling and growth risks worried investors.

Spot Silver Daily Chart through 6/5/2023

Resolution of the debt ceiling crisis – or perhaps more accurately forestalling of the real crisis – along with optimistic economic data may help put a floor under silver. Supply and demand fundamentals remain broadly supportive, but investors remain reticent.

Silver ETF saw outflows of 2.5 Moz last week. Holdings declined by 838 koz on Friday alone, even after the impressive NFP beat.

Additional retracement of the recent losses is needed to re-instill a measure of confidence in the scenario that calls for an eventual retest of the $30 zone. A rise back above $24.50 might spark some interest among those investors.

What those investors should really be looking at are the realities of incredibly strong demand in just about every sector of the physical silver market. At the same time, the market is in deficit and is projected to remain in deficit for the next five years.

That bodes well for the longer-term outlook which should carry silver to new record highs. It’s a pretty compelling story for investors, but they just aren’t paying attention at this point.

PGMs

Platinum is maintaining a corrective stance, although Monday’s rebound offers some encouragement. The industrial metals didn’t like the strong nonfarm payrolls number on Friday as it heightened the possibility of further Fed rate hikes.

Spot Platinum Daily Chart through 6/5/2023

While total vehicle sales dipped in May to 15.6M from 16.6M in April, the general trend seems to suggest the potential for a return to the pre-pandemic level of around 17.5M units.

I remain cautiously bullish on platinum. If the U.S. can avert a recession, as suggested by persistently strong incoming data, scope is seen for a near-term retest of $1200.

Palladium continues to bounce along the bottom, within striking distance of the 4-year low at $1329.18.


Non-Reliance and Risk Disclosure: The opinions expressed here are for general information purposes only and should not be construed as trade recommendations, nor a solicitation of an offer to buy or sell any precious metals product. The material presented is based on information that we consider reliable, but we do not represent that it is accurate, complete, and/or up-to-date, and it should not be relied on as such. Opinions expressed are current as of the time of posting and only represent the views of the author and not those of Zaner Metals LLC unless otherwise expressly noted.

Grant on Gold
Monday, May 15, 2023

Gold remains consolidative near the midpoint of the range that was established in the first week of May. Dips within that range have attracted buying interest around the $2000 level.

Spot Gold Daily Chart through 5/15/2023

Spot Gold Daily Chart through 5/15/2023

Worries about the debt ceiling standoff continue to underpin the yellow metal. While President Biden has expressed some optimism about debt ceiling negotiations, House Speaker McCarthy maintains that the two sides remain “far apart.”

Treasury Secretary Yellen has indicated that default could happen as soon as June 1. Eventually, lawmakers on one side or the other will blink and a deal will be struck before the U.S. defaults on its debt. The debt ceiling will be suspended or raised and in short order, we’ll be butted up against that new ceiling.

In the meantime, it’s worth noting where the national debt is currently, and perhaps, more importantly, its trajectory.

Total Debt: Total Public Debt through Q4 2022

Total Debt: Total Public Debt through Q4 2022

As of year-end 2022, the federal debt stood at $31.4 trillion. According to the U.S. debt clock, that total is now above $31.7 trillion.

It’s hard to imagine what $31.4 trillion looks like. If you’re inclined, check out this graphic from the Visual Capitalist.

Federal Debt Held by the Public, 1900 to 2053: Percentage of Gross Domestic Product

The CBO projects that debt as a percentage of GDP will continue to rise, driven by increasing interest costs and higher spending for major healthcare programs and Social Security. Based on CBO projections, the debt/GDP ratio will approach 200% by 2053.

The Fed’s fight against inflation has pushed debt servicing costs significantly higher. Treasury says interest payments on the debt now stand at $460 bln annually, which is already 13% of total federal spending.

I’ve seen some projections suggesting interest payments on the debt could nearly double in the next year, which would put them on par with the entire defense budget!

This is not a pretty picture. The obvious solution is for lawmakers to cut spending and/or raise taxes. They’ll make a lot of noise about such things, but in reality, they are reluctant to do either.

They’ll have to impose such measures on the middle class to even make a dent. A politician that goes after the middle class doesn’t stay in office very long.

The easier solution – from a politician’s perspective – is to stealthily weaken the currency and inflate away the debt. This is a long-term reality that strongly favors gold ownership as a hedge.

Of course, the U.S. government is not the only one deficit-spending with abandon. U.S. consumer debt rose nearly $150 bln in the first quarter to reach a record $17.05 trillion.

This is troubling amid rising economic instability. There are concerns that the inflation we’ve experienced has pushed people to buy necessities on their credit cards, even as the 500 bps rise in interest rates over the past 14 months is driving up the debt servicing costs on those individuals.

This is not going to end well, particularly if we slip into recession this year and many of the people carrying all that debt lose their jobs.

Silver

Silver plunged 6.6% last week, falling to a 5-week low as growth risks pushed to the fore. It was the white metal’s biggest weekly drop since October of last year.

Spot Silver Daily Chart through 5/15/2023

Spot Silver Daily Chart through 5/15/2023

Other industrial metals, such as copper and zinc took a beating as well, weighed by heightened worries that China’s post-lockdown recovery is losing steam.

More than 38.2% of the March to early-May rally has already been retraced. Silver ETFs saw net inflows of 2.91Moz last week, suggesting investors are finding value on this break. So far, the 50-day SMA is holding on a close basis, keeping more important supports at 23.40 and 23.02 at bay.

Despite the medium-term risks to growth, the longer-term fundamentals remain positive. Silver demand is expected to continue its upward trajectory, while the supply remains in deficit.

A climb back above $25 would ease pressure on the downside and return a measure of credence to the underlying uptrend.

PGMs

Platinum slid last week as well, notching a third consecutive lower weekly close. However, price action remains confined to the range that was established in April.

Spot Platinum Daily Chart through 5/15/2023

Spot Platinum Daily Chart through 5/15/2023

The longer-term fundamentals remain favorable, highlighted by tighter supply associated with power issues in South Africa and ongoing platinum for palladium substitution by the auto sector.

Palladium rotated lower at the end of last week. Despite recent tests of the upside, the longer-term trend remains decisively bearish.

Non-Reliance and Risk Disclosure: The opinions expressed here are for general information purposes only and should not be construed as trade recommendations, nor a solicitation of an offer to buy or sell any precious metals product. The material presented is based on information that we consider reliable, but we do not represent that it is accurate, complete, and/or up-to-date, and it should not be relied on as such. Opinions expressed are current as of the time of posting and only represent the views of the author and not those of Zaner Metals LLC unless otherwise expressly noted.


Grant on Gold – April 24, 2023
Monday, April 24, 2023

Gold slid more than 1% last week, logging a second consecutive lower weekly close. The yellow metal is being weighed by heightened expectations for another Fed rate hike in May, while geopolitical and growth risks are limiting the downside thus far.

Spot Gold Daily Chart through 4/24/23

Focus is already on next week’s FOMC meeting, where another 25-bps rate hike is widely expected. The CME’s FedWatch tool places the probability at 92%. The odds for an additional 25-bps hike in June continue to edge higher and now stand at 24.1%.

The Fed seems to think they have more to do on the inflation front, even as the market’s expectations for inflation continue to moderate. The index of common inflation expectations fell to 2.22% in Q1, the lowest level since Q2-21.

Meanwhile, incoming data continue to suggest the economy is slowing. The minutes from the March FOMC meeting revealed that even the central bank’s staff believe a mild recession will begin “later this year, with a recovery over the subsequent two years.”

In addition, job growth slowed in March and is forecast to come in weaker yet in April. Median expectations for nonfarm payrolls are +175k, down from +236kn in March.

A recession would certainly knock inflation lower, as would slower jobs and wage growth. However, the market seems to believe the Fed won’t wait for any of that to happen and will instead remain aggressive in battling price risks. That strategy does not bode well for a soft landing.

With gold trading less than 4% off its all-time high of $2075.28, the yellow metal is arguably well positioned to push to record highs if the Fed (and other central banks) are put in the position of having to reverse course and start easing policy. My first significant technical objective would be $2194.58 based on a Fibonacci projection.

Last week I suggested short-term downside potential was to $1959. So far, the market has traded as low as $1969.30. There is scope for further tests of the downside until the next policy announcement on May 3rd, particularly if prospects for a June rate hike continue to increase.

Silver

Silver ended last week with a 1.1% loss, but a firmer tone prevailed on Monday. Thus far, the white metal is holding its 20-day moving average.

Spot Silver Daily Chart through 4/24/23

While the trend remains favorable, rising economic growth risks warrant a measure of caution. Silver ETFs saw significant outflows last week, suggesting that investors may lack confidence in the fundamentals needed to push silver back to the critical $30 zone.

A recession later in the year could result in a significant retracement of the March-April rally, but I also suspect the Fed will be quick to start cutting rates in reaction. That would help limit downside potential as will the more favorable economic prospects for China as the world’s second-largest economy continues to recover from COVID lockdowns.

Last week, the Silver Institute highlighted that “all major demand categories achieved record highs in 2022.” Total silver demand jumped 18% y/y to a record 1.242 billion ounces.

Amid this strong demand environment and a marginal contraction in mine output, the supply deficit reached 237.7 Moz in 2022. The Silver Institute called it "possibly the most significant deficit on record."

The Silver Institute is projecting that the silver market will remain out of balance in 2023, to the tune of 142.1 Moz. If confirmed, it would be the third consecutive annual supply deficit, which should help underpin the market.

Renewed probes about $26 would return focus to the $26.95 high from March 8, 2022. The latter is seen as the trigger that would put the key COVID-era highs at $29.86/$30.14 in play.

On the downside, a violation of the 20-day SMA at $24.83 would shift attention to congestive support around $23.70, which corresponds with the 38.2% retracement level of the rally from $19.90. Short-term losses are still seen as corrective in nature.

PGMs

Platinum surged nearly 8% last week, establishing a 13-month high at $1143.25. It was the sixth consecutive higher weekly close.

 Spot Platinum Daily Chart through 4/24/23
Spot Platinum Daily Chart through 4/24/23

However, platinum had become quite overextended, the most since December 2020. Corrective pressures emerged on Monday, resulting in a loss of 3.6%.

At this point, I’m viewing this week’s setback as corrective.  While mounting growth risks do have the potential to take the wind out of platinum’s sails, supply and demand fundamentals are likely to limit the downside.

Persistent power issues in South Africa should keep supply tight. The deficit is expected to reach 556 koz this year.

On the demand side of the equation, global light vehicle sales are expected to increase by 6.2% in 2023 to 86.1 million units. The China Association of Automobile Manufacturers (CAAM) is projecting a 3% bump in Chinese sales to 27.6 million units. That would be nearly a third of projected global sales.

CAAM is anticipating that demand for “new-energy” vehicles will increase by 35% to 9 million units. That will do more for silver and copper than platinum.

While auto sector supply chain issues are still likely to be a problem, ongoing platinum for palladium substitution and increased loading in catalytic converters should help to underpin platinum.

Despite 6-weeks of gains in palladium, the chart suggests the gains were corrective in nature. Recent probes above the 100-day SMA could not be sustained and palladium retreated more than 4% on Monday.

Spot Palladium Daily Chart through 4/24/23

A retreat below $1489/87 would return a measure of credence to the dominant downtrend, returning focus to the $1329.18 low from March 9th.


Non-Reliance and Risk Disclosure: The opinions expressed here are for general information purposes only and should not be construed as trade recommendations, nor a solicitation of an offer to buy or sell any precious metals product. The material presented is based on information that we consider reliable, but we do not represent that it is accurate, complete, and/or up-to-date, and it should not be relied on as such. Opinions expressed are current as of the time of posting and only represent the views of the author and not those of Zaner Metals LLC unless otherwise expressly noted.