Zaner Daily Precious Metals Commentary
Thursday, July 25, 20247/25/2024
Gold and silver weighed by China concerns
OUTSIDE MARKET DEVELOPMENTS: President Biden spoke to the nation last night saying, “I’ve decided the best way forward is to pass the torch to a new generation." He didn't provide any information about what prompted his decision to drop out of the race. Was it his health? Was it the diminished prospects for victory after his debate performance? Was it pressure from within his own party? It likely was all of those things.
Israeli Prime Minister Benjamin Netanyahu delivered a fiery speech before a joint session of Congress yesterday, vowing "total victory" over Hamas. Despite global protests and international diplomatic pressure, Netanyahu remains committed to the destruction of Hamas.
Netanyahu is supposed to meet separately with President Biden and VP Harris today. Donald Trump said on Truth Social that he would meet with Netanyahu on Friday.
China's central bank unexpectedly cut its MLF rate by 20 bps to 2.30%. The PBoC also injected 235.1 bln yuan into markets through a reverse repo operation.
However, markets reacted negatively, reading the urgency of this week's PBoC operations as evidence that growth risks in China are greater than previously perceived. Deflation and slower growth in the world's second-largest economy have far-reaching global implications. That seems to be manifesting most notably in commodity and equity markets this week.
Chinese leaders announced their optimistic Third Plenum policy goals on Thursday but provided no details on how they might be achieved. China is on the verge of deflation and possibly a debt crisis. Gordon G. Chang worries that China's having its 2008 financial crisis at the worst possible time.
Major U.S. stock indexes fell sharply on Wednesday. The Nasdaq lost 3.6%, its biggest daily decline since October 2022. The S&P 500 ended the day with a 2.3% decline, its worst single-day performance since December 2022. U.S. shares are under pressure again today.
U.S. Q2 Advance GDP came in at 2.8%, well above expectations of 1.9%, versus 1.4% in Q1. The beat was attributed to a solid 2.3% rise in consumption.
Better-than-expected growth in the U.S. somewhat tempers the rising concerns about China. One might also imagine that today's GDP print decreases the urgency for the Fed to start easing, yet the market is still pricing in a September rate cut.
U.S. durable orders plunged 6.6% in June, well below expectations of +0.6%, versus +0.1% in May. A huge 20.5% in transportation orders (most notably aircraft) is the reason. The ex-transportation reading was +0.5%.
GOLD
OVERNIGHT CHANGE THROUGH 6:00 AM CDT: -$17.02 (-0.71%)
5-Day Change: -$80.36 (-3.29%)
YTD Range: $1,986.16 - $2,481.63
52-Week Range: $1,812.39 - $2,481.63
Weighted Alpha: +22.08
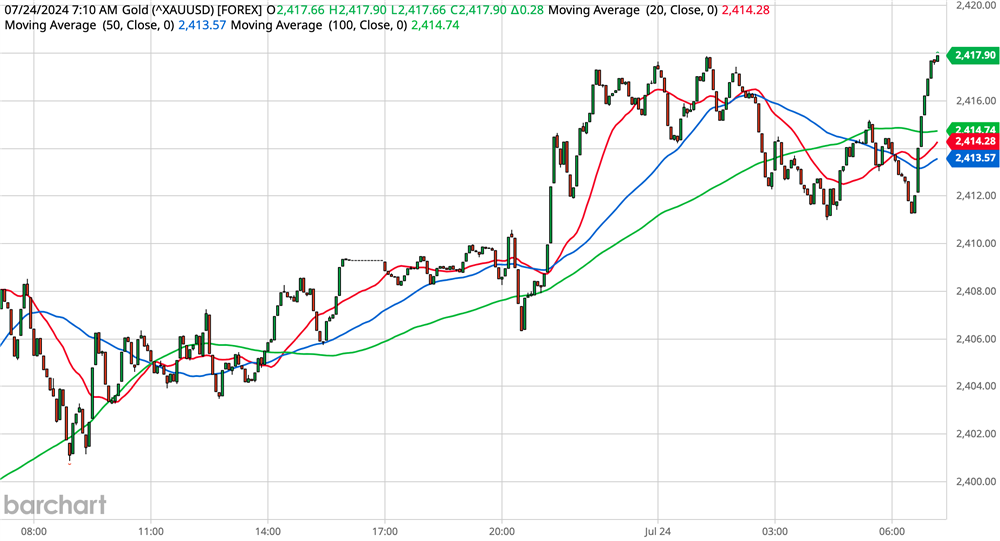
Gold tumbled to 2-week lows after failing to sustain Wednesday's gains. Mounting concerns about the Chinese economy are negatively impacting global markets broadly.
The overseas breach of Monday's low at $2,385.50 also constituted a violation of the 20-day moving average and likely triggered stops.
The yellow metal has completed a 61.8% retracement of the rally from $2,287.64 (07-Jun low) to $2,481.63 (17-Jul high). The $2,361.74 Fibonacci level corresponds closely with the 50-day moving average at $2,360.62.
One might expect gold to garner support from safe-haven interest, but sometimes deleveraging pressures must play out first. Gold and silver are components of just about every commodity fund and ETF. As investors exit commodities they are invariably selling gold and silver as well.
Minor chart support is noted at $2,355.03 down to $2,352.28. Penetration of this area would leave gold vulnerable to the next Fibonacci level at $2,329.15. Below that, the June lows at $2,295.86 and $2,287.64 would be back in play.
First resistance is defined by intraday chart points around $2,375.00. The halfway back point of today's range is at $2,381.23. However, $2,397.98/$2,400.70 needs to be regained to set a more positive short-term tone.
SILVER
OVERNIGHT CHANGE THROUGH 6:00 AM CDT: -$0.915 (-3.17%)
5-Day Change: -$2.298 (-7.70%)
YTD Range: $21.945 - $32.379
52-Week Range: $20.704 - $32.379
Weighted Alpha: +14.32
Silver extended losses in overseas trading to negate key support at $28.618 (26-Jun low). Stops were triggered pushing the white metal through the 100-day moving average at $28.442 to a new 11-week low of $27.524.
Silver is being dragged lower with the rest of the commodities complex amid rising growth risks in China. While the U.S. economy still looks healthy based on today's advanced Q2 GDP print, China is the second-largest global economy and our third-largest trading partner.
The silver market has retreated almost exactly 15% since establishing an 11-year high at $32.379 on 21-May. The market remains decisively in a corrective mode.
While the market is presently trading off the lows, the downside remains vulnerable. The next significant support level I'm watching is $27.404 (78.6% retrace of the rally from $26.049 to $32.379). Today's earlier low at $27.524 makes a good intervening barrier.
Intraday resistance is noted at $27.990/$28.032. The halfway back point of today's decline comes in at $28.232. It would probably take a rebound above $29 to re-instill some measure of optimism in the bull camp.
Peter A. Grant
Vice President, Senior Metals Strategist
Zaner Metals LLC
Tornado Precious Metals Solutions by Zaner
312-549-9986 Direct/Text
[email protected]
www.ZanerPreciousMetals.com
www.TornadoBullion.com
X: @GrantOnGold
X: @ZanerMetals
Facebook: @ZanerPreciousMetals
Non-Reliance and Risk Disclosure: The opinions expressed here are for general information purposes only and should not be construed as trade recommendations, nor a solicitation of an offer to buy or sell any precious metals product. The material presented is based on information that we consider reliable, but we do not represent that it is accurate, complete, and/or up-to-date, and it should not be relied on as such. Opinions expressed are current as of the time of posting and only represent the views of the author and not those of Zaner Metals LLC unless otherwise expressly noted.