Gold remains consolidative near the midpoint of the range that was established in the first week of May. Dips within that range have attracted buying interest around the $2000 level.
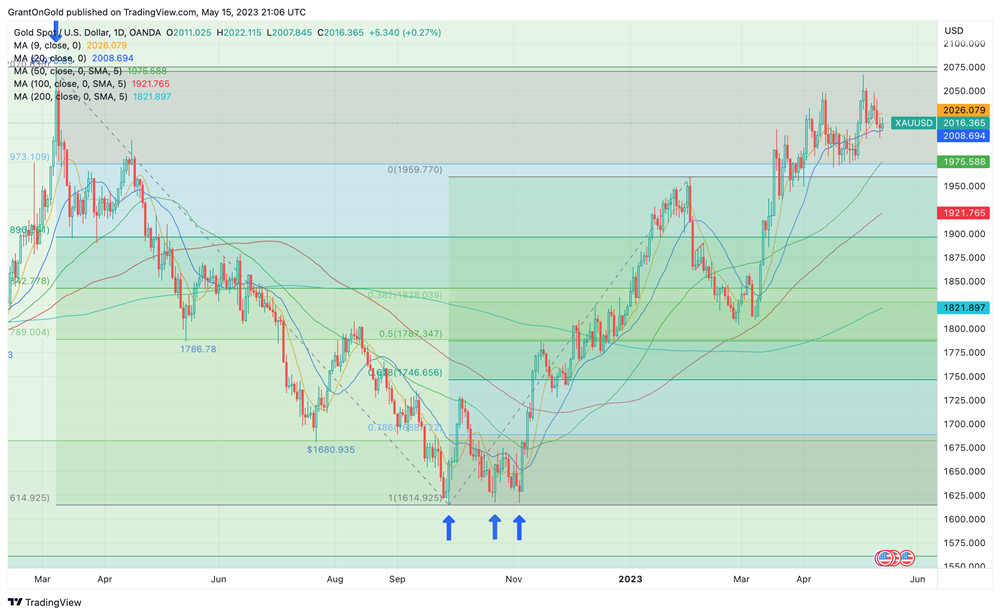
Spot Gold Daily Chart through 5/15/2023
Worries about the debt ceiling standoff continue to underpin the yellow metal. While President Biden has expressed some optimism about debt ceiling negotiations, House Speaker McCarthy maintains that the two sides remain “far apart.”
Treasury Secretary Yellen has indicated that default could happen as soon as June 1. Eventually, lawmakers on one side or the other will blink and a deal will be struck before the U.S. defaults on its debt. The debt ceiling will be suspended or raised and in short order, we’ll be butted up against that new ceiling.
In the meantime, it’s worth noting where the national debt is currently, and perhaps, more importantly, its trajectory.
.png)
Total Debt: Total Public Debt through Q4 2022
As of year-end 2022, the federal debt stood at $31.4 trillion. According to the U.S. debt clock, that total is now above $31.7 trillion.
It’s hard to imagine what $31.4 trillion looks like. If you’re inclined, check out this graphic from the Visual Capitalist.
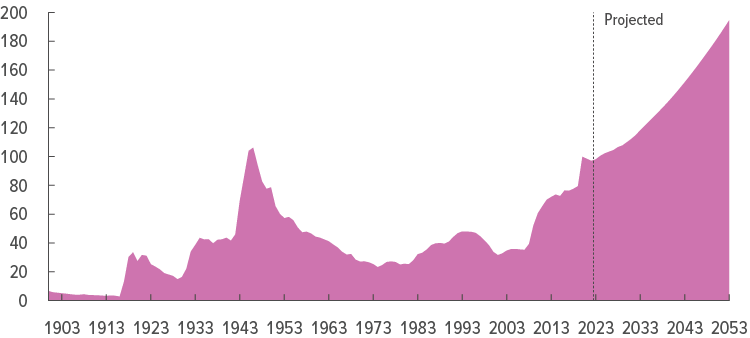
Federal Debt Held by the Public, 1900 to 2053: Percentage of Gross Domestic Product
The CBO projects that debt as a percentage of GDP will continue to rise, driven by increasing interest costs and higher spending for major healthcare programs and Social Security. Based on CBO projections, the debt/GDP ratio will approach 200% by 2053.
The Fed’s fight against inflation has pushed debt servicing costs significantly higher. Treasury says interest payments on the debt now stand at $460 bln annually, which is already 13% of total federal spending.
I’ve seen some projections suggesting interest payments on the debt could nearly double in the next year, which would put them on par with the entire defense budget!
This is not a pretty picture. The obvious solution is for lawmakers to cut spending and/or raise taxes. They’ll make a lot of noise about such things, but in reality, they are reluctant to do either.
They’ll have to impose such measures on the middle class to even make a dent. A politician that goes after the middle class doesn’t stay in office very long.
The easier solution – from a politician’s perspective – is to stealthily weaken the currency and inflate away the debt. This is a long-term reality that strongly favors gold ownership as a hedge.
Of course, the U.S. government is not the only one deficit-spending with abandon. U.S. consumer debt rose nearly $150 bln in the first quarter to reach a record $17.05 trillion.
This is troubling amid rising economic instability. There are concerns that the inflation we’ve experienced has pushed people to buy necessities on their credit cards, even as the 500 bps rise in interest rates over the past 14 months is driving up the debt servicing costs on those individuals.
This is not going to end well, particularly if we slip into recession this year and many of the people carrying all that debt lose their jobs.
Silver
Silver plunged 6.6% last week, falling to a 5-week low as growth risks pushed to the fore. It was the white metal’s biggest weekly drop since October of last year.
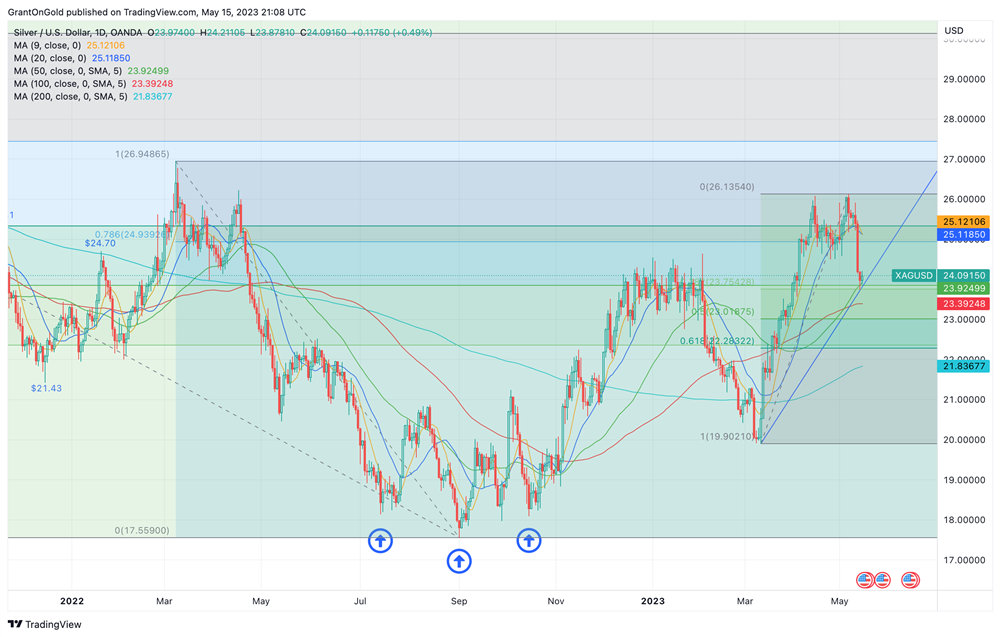
Spot Silver Daily Chart through 5/15/2023
Other industrial metals, such as copper and zinc took a beating as well, weighed by heightened worries that China’s post-lockdown recovery is losing steam.
More than 38.2% of the March to early-May rally has already been retraced. Silver ETFs saw net inflows of 2.91Moz last week, suggesting investors are finding value on this break. So far, the 50-day SMA is holding on a close basis, keeping more important supports at 23.40 and 23.02 at bay.
Despite the medium-term risks to growth, the longer-term fundamentals remain positive. Silver demand is expected to continue its upward trajectory, while the supply remains in deficit.
A climb back above $25 would ease pressure on the downside and return a measure of credence to the underlying uptrend.
PGMs
Platinum slid last week as well, notching a third consecutive lower weekly close. However, price action remains confined to the range that was established in April.
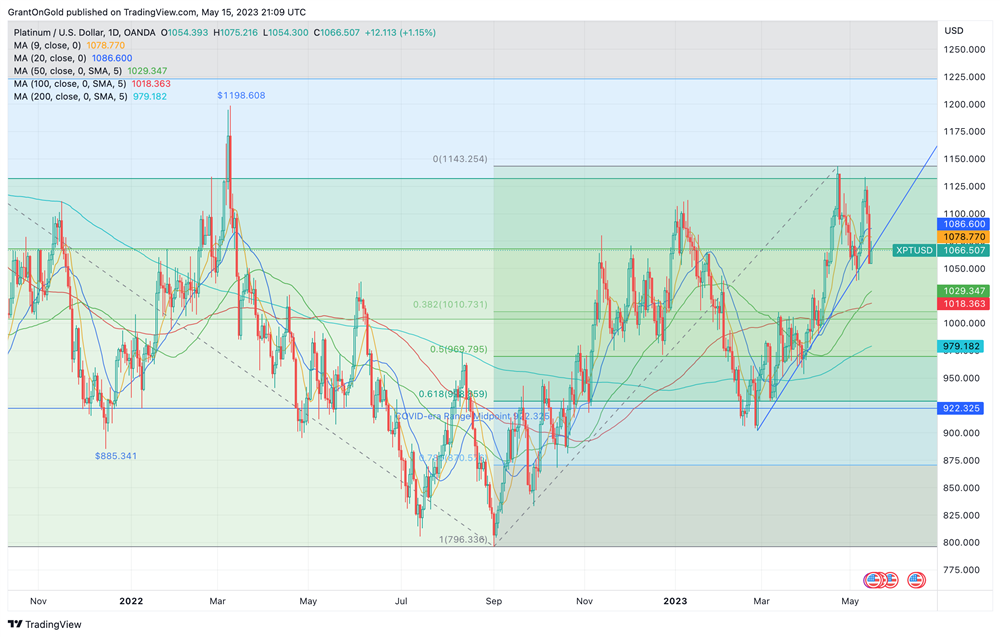
Spot Platinum Daily Chart through 5/15/2023
The longer-term fundamentals remain favorable, highlighted by tighter supply associated with power issues in South Africa and ongoing platinum for palladium substitution by the auto sector.
Palladium rotated lower at the end of last week. Despite recent tests of the upside, the longer-term trend remains decisively bearish.
Non-Reliance and Risk Disclosure: The opinions expressed here are for general information purposes only and should not be construed as trade recommendations, nor a solicitation of an offer to buy or sell any precious metals product. The material presented is based on information that we consider reliable, but we do not represent that it is accurate, complete, and/or up-to-date, and it should not be relied on as such. Opinions expressed are current as of the time of posting and only represent the views of the author and not those of Zaner Metals LLC unless otherwise expressly noted.
effort to make a top notch article… but what can I say… I put things off
a whole lot and never seem to get nearly anything done.
casino en ligne
excellent points altogether, you just gained
a new reader. What might you recommend in regards to your publish that you just made
a few days in the past? Any sure?
casino en ligne
I wanted to thank you for this excellent read!! I certainly enjoyed
every little bit of it. I have got you saved as a favorite to look at new stuff
you post…
casino en ligne
Truly when someone doesn't understand after that its up to other users that they will help, so
here it takes place.
casino en ligne
Now I am going to do my breakfast, after having my
breakfast coming again to read other news.
casino en ligne
I'd like to find out more? I'd care to find out some additional information.
casino en ligne
Fantastic website you have here but I was curious if you knew of any forums that cover the same topics
talked about in this article? I'd really love to be a part of online community where I can get feedback
from other knowledgeable people that share the same interest.
If you have any suggestions, please let me know. Appreciate it!
casino en ligne
When someone writes an article he/she retains the idea of
a user in his/her brain that how a user can be aware of it.
So that's why this post is outstdanding. Thanks!
casino en ligne
Hi, after reading this remarkable post i am too delighted to share my know-how here with mates.
casino en ligne
Hello! I know this is sort of off-topic but
I needed to ask. Does running a well-established blog such as yours
take a large amount of work? I am completely new to operating a blog but I
do write in my diary on a daily basis. I'd like
to start a blog so I can easily share my own experience and thoughts online.
Please let me know if you have any kind of suggestions or
tips for new aspiring blog owners. Appreciate it!
casino en ligne