With the dollar continuing to trade in a range without signs of clear direction and August gold finding minimal support at yesterday's low of $1955.40, the selloff has been temporarily slowed or arrested.
However, the developing pattern on the dollar charts with 4 consecutive lower highs and 3 consecutive lower lows should provide hope for gold and silver bulls ahead especially if today's US jobs-related data points to a soft economy.
Unfortunately for the bull camp investment signals for gold remain bearish with ETF holdings yesterday declining 30,840 ounces and, in the process, declining for the 7th straight session...[MORE]
Please subscribe to receive the full report via email by clicking here.
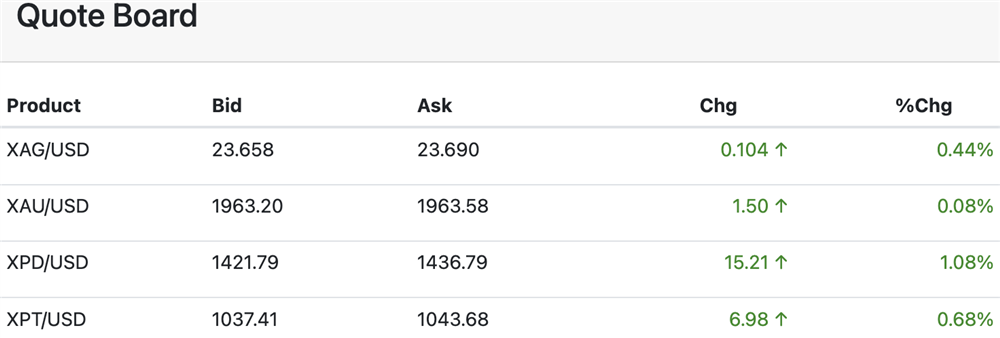
June 8 (Reuters) - Gold prices rose on Thursday on a slight pullback in the U.S. dollar but investor caution surrounding the Federal Reserve’s interest rate strategy and other economic cues that may influence it kept bullion hemmed in a relatively tight range.
Spot gold rose 0.3% to $1,945.69 per ounce by 7:26 a.m. (1126 GMT) after shedding 1% in the previous session. U.S. gold futures rose 0.1% to $1,959.90...[LINK]
While early action today in gold and silver could produce a narrow trade, the bear camp is somewhat emboldened by comments from a former vice chair of the Fed who predicted further rate hikes this cycle.
The bear camp should also be emboldened by 6 straight outflows from gold and silver ETF holdings. In fact, silver ETF holdings flipped from a net inflow for the year to a net outflow for the year with net sales reaching 3.08 million ounces.
In a minimally supportive demand development (more psychological than physical) Chinese gold reserves at the end of May were 67.27 million ounces compared to 66.76 million ounces at the end of April...[MORE]
Please subscribe to receive the full report via email by clicking here.
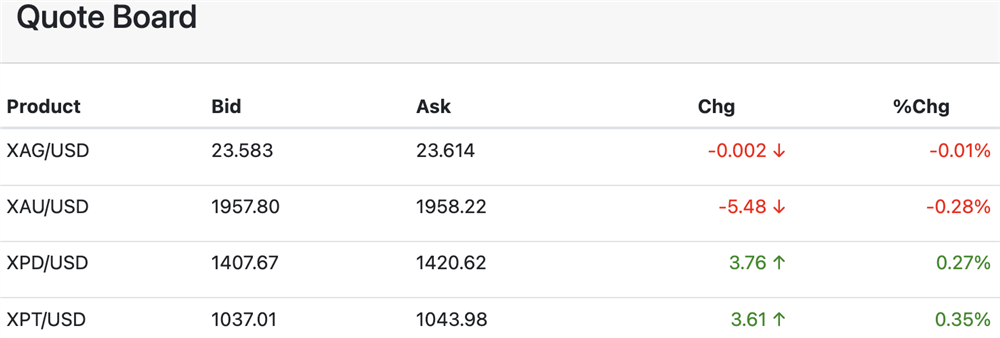
June 7 (Reuters) - Gold traded in a narrow range on Wednesday as traders refrained from making big bets while positioning for fresh economic data and the U.S. Federal Reserve’s interest rate strategy next week.
Spot gold was little changed at $1,962.47 per ounce by 1114 GMT, holding in a $13 range. U.S. gold futures fell 0.1% to $1,979.50...[LINK]
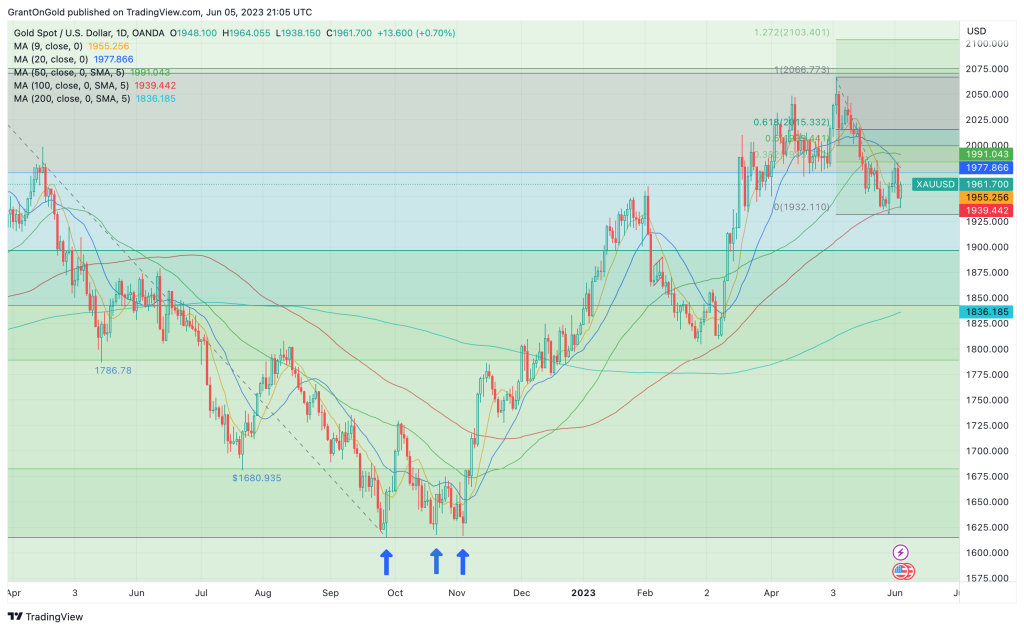
While August gold has managed to maintain yesterday's recovery bounce, the gold market starts Tuesday's trade in the middle of the near-term anticipated trading range of $1950 and $2000.
With the August gold contract falling sharply yesterday, posting a 4-day low early and then mounting an impressive $22 per ounce recovery off the low, the market might have become short-term oversold.
Not surprisingly, the silver market also forged a range-down reversal from the initial low of $0.25. We suspect the ability to reject the early washouts on Monday was primarily the result of a reversal down in the dollar index which by midsession was trading 38 ticks below the early high...[MORE]
Please subscribe to receive the full report via email by clicking here.
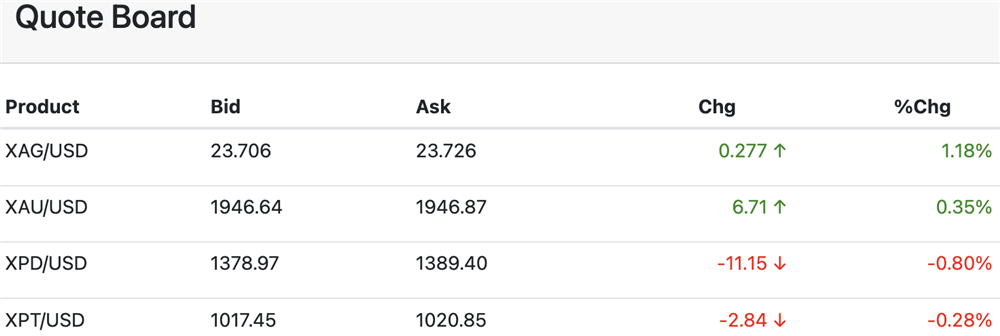
June 6 (Reuters) - Gold prices traded in a narrow range on Tuesday as investors sought more clarity around the U.S. Federal Reserve’s policy outlook, but lower Treasury yields kept a floor under non-yielding bullion.
Spot gold fell 0.1% to $1,960.70 per ounce by 0938 GMT, while U.S. gold futures rose 0.2% to $1,977.20...[LINK]
Gold remains defensive below the $2000 level as ongoing strength in the labor market keeps the threat of inflation highlighted. That in turn makes it difficult to rule out further rate hikes.
Spot Gold Daily Chart through 6/5/2023
U.S. nonfarm payrolls for May came in at a solid +339k, well above market expectations of +193k, versus a positively revised +294k in April. While the unemployment rate rose to 3.7%, strength in the payrolls numbers diminishes the likelihood that a recession is impending.
This also seems to provide some additional leeway for the Fed to further tamp inflation with another rate hike this month, although that’s not really being reflected in Fed funds futures yet. The CME’s FedWatch tool puts the probability of a 25-bps rate hike at 24.1% as of Monday.
The resolution of the latest debt-ceiling standoff has taken some of the haven bid out of gold. While default has been averted, there doesn’t seem to be any palpable sense of relief.
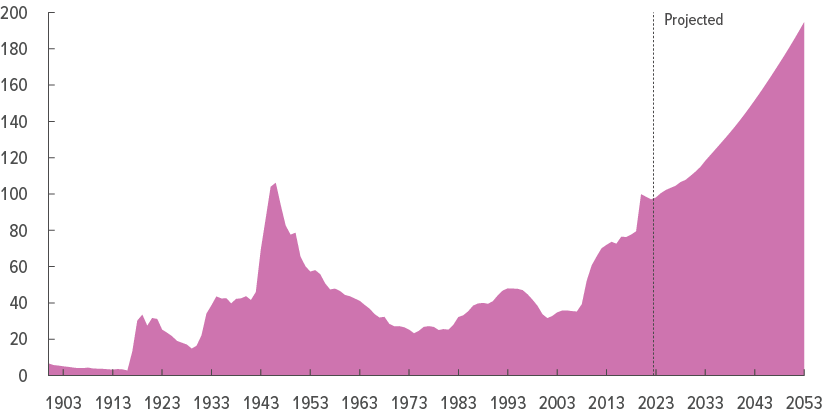
The debt ceiling has been suspended until January 2025, allowing Treasury to borrow as much as it wants until the debt ceiling is reinstated. The CBO projects total debt held by the public to grow to $27.4 trillion by the end of 2024 and exceed 100% of GDP. Gross debt is expected to be north of $34 trillion.
Federal Debt Held by the Public, 1900 to 2053
By the end of 2033, total debt held by the public is projected to rise to $46.4 trillion, and 118.2% of GDP. Gross debt at the end of 2033 will be approaching $52 trillion.
Those numbers and that chart – especially the trajectory – are reasons for considerable concern. The debt and the servicing costs are an ever-growing millstone around the neck of economic growth potential.
While this is certainly a grim reality for the U.S., the explosion of debt is a global phenomenon.
A recent report by the consultancy group McKinsey found that since 2000, “Globally, for every $1.00 of net investment, $1.90 of additional debt was created.” This was largely due to rising debt levels and quantitative easing (money printing). During 2020 and 2021, “The creation of new debt accelerated to $3.40 for each $1.00 in net investment.”
That’s pretty staggering. Not surprisingly, investors are wondering where they can turn to safeguard their wealth. A recent Bloomberg survey showed that 52% of professional investors and 46% of retail investors picked gold as their top safety choice. Treasuries were a distant second at 14% and 15% respectively.
According to a Gallup poll gold has vaulted into second place for the best long-term investment, behind real estate. According to the poll, gold is now comfortably favored above stocks/mutual funds, Savings accounts/CDs, and bonds.
It’s worth recalling that the world’s central banks have been buying gold voraciously. Central Bank gold buying reached a record 1,078 tonnes in 2022. This year is off to a strong start as well, with Q1 demand hitting a record 228 tonnes, 34% higher than the previous Q1 record set in 2013.
While much has been said in recent weeks about gold weakness stemming from a stronger dollar, keep in mind that the yellow metal is only about $100 (less than 6%) off its all-time high of $2075.28. Savvy investors will likely view short-term setbacks as buying opportunities.
Silver
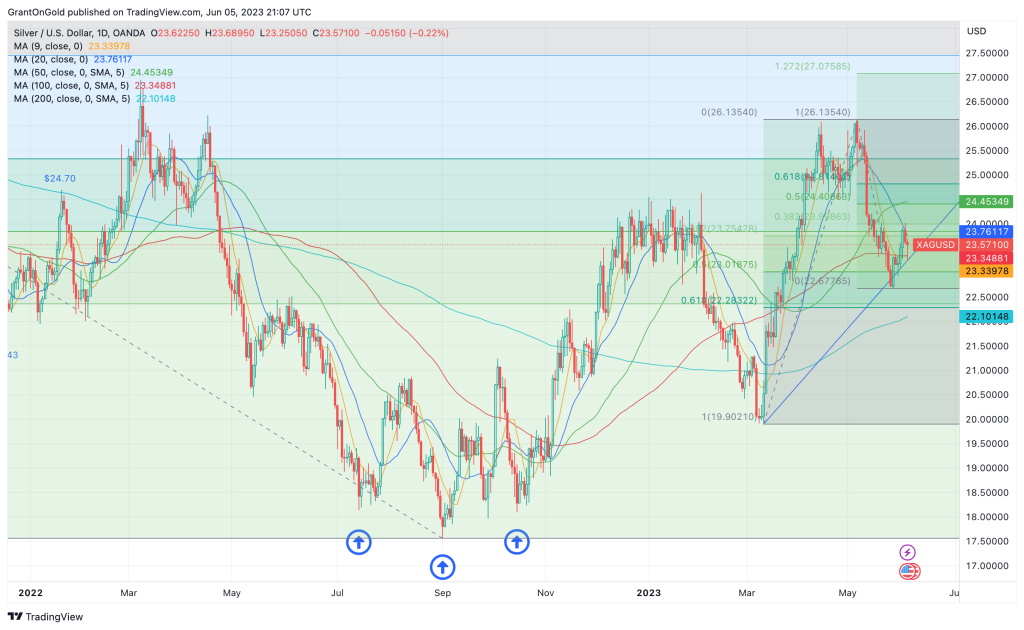
Silver ended May with a loss of 6%. It was the first lower monthly close in three, as uncertainty over the debt ceiling and growth risks worried investors.
Spot Silver Daily Chart through 6/5/2023
Resolution of the debt ceiling crisis – or perhaps more accurately forestalling of the real crisis – along with optimistic economic data may help put a floor under silver. Supply and demand fundamentals remain broadly supportive, but investors remain reticent.
Silver ETF saw outflows of 2.5 Moz last week. Holdings declined by 838 koz on Friday alone, even after the impressive NFP beat.
Additional retracement of the recent losses is needed to re-instill a measure of confidence in the scenario that calls for an eventual retest of the $30 zone. A rise back above $24.50 might spark some interest among those investors.
What those investors should really be looking at are the realities of incredibly strong demand in just about every sector of the physical silver market. At the same time, the market is in deficit and is projected to remain in deficit for the next five years.
That bodes well for the longer-term outlook which should carry silver to new record highs. It’s a pretty compelling story for investors, but they just aren’t paying attention at this point.
PGMs
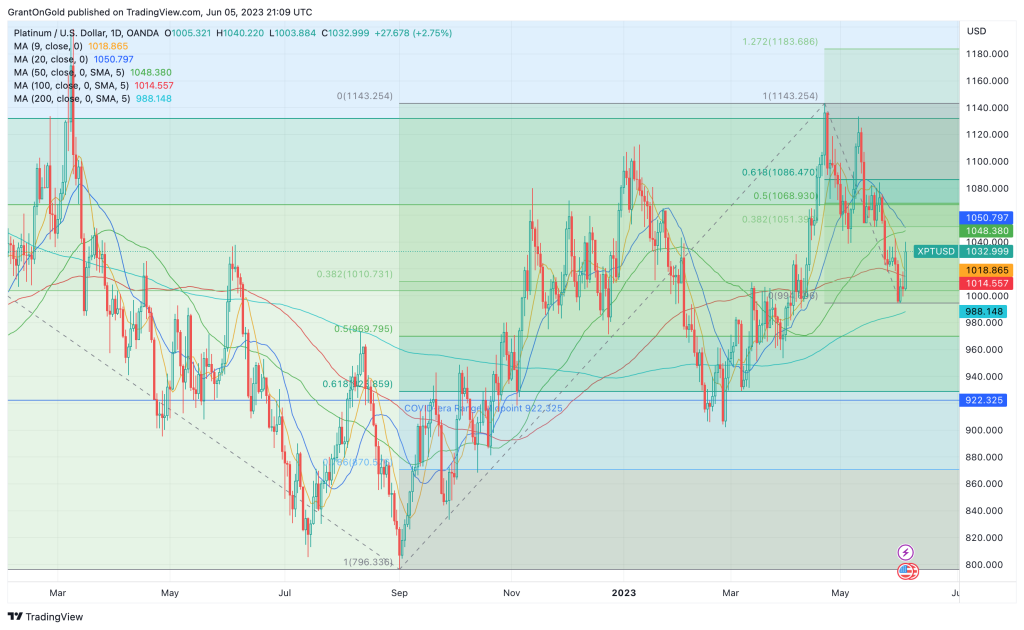
Platinum is maintaining a corrective stance, although Monday’s rebound offers some encouragement. The industrial metals didn’t like the strong nonfarm payrolls number on Friday as it heightened the possibility of further Fed rate hikes.
Spot Platinum Daily Chart through 6/5/2023
While total vehicle sales dipped in May to 15.6M from 16.6M in April, the general trend seems to suggest the potential for a return to the pre-pandemic level of around 17.5M units.
I remain cautiously bullish on platinum. If the U.S. can avert a recession, as suggested by persistently strong incoming data, scope is seen for a near-term retest of $1200.
Palladium continues to bounce along the bottom, within striking distance of the 4-year low at $1329.18.
Non-Reliance and Risk Disclosure: The opinions expressed here are for general information purposes only and should not be construed as trade recommendations, nor a solicitation of an offer to buy or sell any precious metals product. The material presented is based on information that we consider reliable, but we do not represent that it is accurate, complete, and/or up-to-date, and it should not be relied on as such. Opinions expressed are current as of the time of posting and only represent the views of the author and not those of Zaner Metals LLC unless otherwise expressly noted.